
While Bitcoin’s price may seem to be stabilizing, this alone does not indicate that a definitive bottom has been reached. A recent analysis by crypto expert @CryptoTice_ suggests that the current market conditions do not align with historical indicators of a genuine Bitcoin price bottom. Instead of fixating on short-term stability, he emphasizes the crucial factors investors should monitor before declaring the cycle as concluded.
$BTC Price Cycles Indicate A Later Bottom Formation
The analyst points out one of the most telling signs is related to Bitcoin’s established four-year cycle. The chart accompanying his analysis illustrates previous cycles following halvings in 2012, 2016, 2020, and projected for 2024, showcasing a consistent pattern. In each instance, Bitcoin’s price reached its lowest point after prolonged declines followed by consolidation phases.
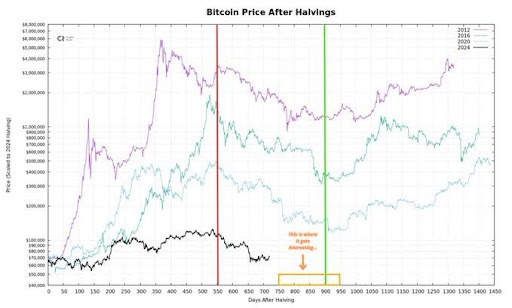
The current cycle identifies a critical timeframe between approximately 800 and 950 days post-halving—this is when previous cycles began nearing their ultimate lows. This segment of the chart is further supported by a vertical marker indicating alignment with late 2026. This timing challenges prevailing assumptions that a bottom could materialize earlier in the year; historically speaking, there are no clear examples of bottoms forming in Q1, Q2 or Q3 within this cyclical structure. Past trends consistently demonstrate extended declines followed by an eventual stabilization period before reaching true market lows.
In practical terms, this implies that if historical patterns hold true, we are still too early in this cycle for any definitive conclusions about market stability or recovery.
Key Indicators To Monitor Before Declaring A Bottom
Timing represents just one aspect; another equally significant factor is how the market behaves during downturns. According to this analysis, bottoms are characterized not only by price movements but also by participant reactions as prices decline.
A recurring trend across various cycles shows that prices typically drop first before narratives emerge attempting to rationalize these decreases. Following these narratives comes capitulation—a phase where confidence wanes and less resilient participants exit from positions—leading eventually to the formation of a lasting bottom.
Currently though it appears we have yet to reach this final stage; overall market sentiment still exhibits confidence with many participants actively buying and anticipating imminent recoveries—a behavior often indicative that we have not yet hit rock bottom.
The key takeaway for investors is straightforward: rather than merely observing whether prices have ceased their decline focus should shift towards indicators like diminishing confidence levels rising volatility and an overarching sense of capitulation among traders until these elements align more closely with later stages within historical cycles it remains unlikely that we’ve witnessed any real formation at present time .
Ultimately recognizing when Bitcoin’s price has truly found its floor necessitates synchronization between timing signals along with sentiment metrics based upon both past behaviors alongside ongoing developments those markers remain unfulfilled at present moment .