The price of Bitcoin is nearing the $60,000 mark as it continues its significant downturn.
Today, Bitcoin’s value has further declined after a prolonged slump that has seen it lose over half of its worth since reaching an all-time high in October. Currently, it’s trading around $66,000 following a notable sell-off that has pushed prices close to the $60,000 threshold.
Since approximately December 2025, Bitcoin’s price trajectory has been predominantly downward. It fell from levels exceeding $100,000 into a fluctuating range that keeps traders questioning whether the market has found a stable bottom.
The price dipped below the critical psychological level of $70,000 on February 5th. This triggered substantial selling pressure across both spot and derivatives markets. The drop can be attributed to macroeconomic uncertainties and institutional risk aversion alongside volatility in tech stocks that often correlate with crypto investments.
Following this sell-off event, Bitcoin’s price struggled to regain upward momentum and remained within the range of $66,000 to $67,000 while fluctuations between these values and up to $72,000 have become commonplace.
K33: Potential Local Bottom for Bitcoin Price
This week K33 Research suggested that the recent plunge towards $60K might signify a local bottom due to what they describe as “capitulation-like conditions” observed in volume metrics and funding rates among others.
K33’s Head of Research Vetle Lunde highlighted numerous extreme outliers accompanying this movement based on reports from The Block. Trading volumes surged into the 95th percentile while funding rates plummeted to levels reminiscent of those during March 2023’s banking crisis. Options skews reached figures typically associated with heightened stress seen during last year’s bear market.
Moreover, momentum indicators entered unusual territory; after continuous selling since January 20th led Bitcoin’s daily Relative Strength Index (RSI) down to just 15.9—one of its most oversold positions since 2015. The RSI measures recent price changes on a scale from zero to one hundred; readings below thirty are generally interpreted as oversold conditions.
Lunde pointed out parallels between current extremes and previous lows observed in March 2020 and November 2018 which coincided with significant cycle bottoms.
Sentiment indicators reflected similar distress; during this latest sell-off phase the Crypto Fear & Greed Index dropped down to six—its second-lowest recorded level—highlighting deep pessimism as prices neared their low point around sixty thousand dollars.
This trading activity was characterized by what Lunde referred to as “hyperactive trading.” On February sixth alone spot volume reached an impressive thirty-two billion dollars—the highest ever recorded within two days—with back-to-back sessions hitting volumes at their ninety-fifth percentile—a pattern only previously witnessed once before amid last year’s FTX collapse.
K33 noted such extraordinary days often align closely with local pricing extremes although consolidation phases may follow thereafter.
Derivatives markets mirrored these pressures too: Daily annualized funding rates for perpetual swaps dropped dramatically down -15.46% on February sixth—the lowest rate since March twenty-three—as well seven-day averages fell even lower at -3.5%, marking their weakest performance since September twenty-four.
Options positioning shifted into what Lunde described as “extreme defensive territory,” akin periods surrounding major events like Luna collapse or FTX failure.
ETF activity also saw remarkable increases: BlackRock’s iShares Trust (IBIT) experienced record daily trading volume surpassing ten billion dollars on February fifth along with two hundred eighty-four million shares traded making it one amongst five largest daily outflows tracked post-launch contributing net weekly withdrawals totaling thirteen thousand six hundred seventy BTC despite later inflows.
Considering all factors combined K33 concluded extensive volatility patterns along yields skews ETF flows support sixty-thousand-dollar valuation being likely candidate for short-term bottom anticipating prolonged consolidation lasting weeks or months likely ranging between sixty-seventy-five thousand having elevated chances retesting support yet limited expectations downside potential remaining ahead.
Billionaires Buying Into Dip
A number prominent industry veterans view downturns present opportunities rather than threats – Val Vavilov co-founder Bitfury early cryptocurrency adopter remarked latest market rout provides chance rebalancing portfolio increasing exposure.
“Falling prices offer us opportunity rebalance our holdings purchase some bitcoin low cost,” he mentioned according Bloomberg noting however bitcoin constitutes merely part broader strategy now encompassing artificial intelligence data centers too.
Technical analysts remain vigilant key resistance levels following rebound off sixty-thousand dollar mark where immediate resistance sits near seventy-one eight-hundred whilst seventy-four five-hundred represents Fibonacci retracement benchmark
Further resistances exist around seventy-nine eighty-four thousands respectively
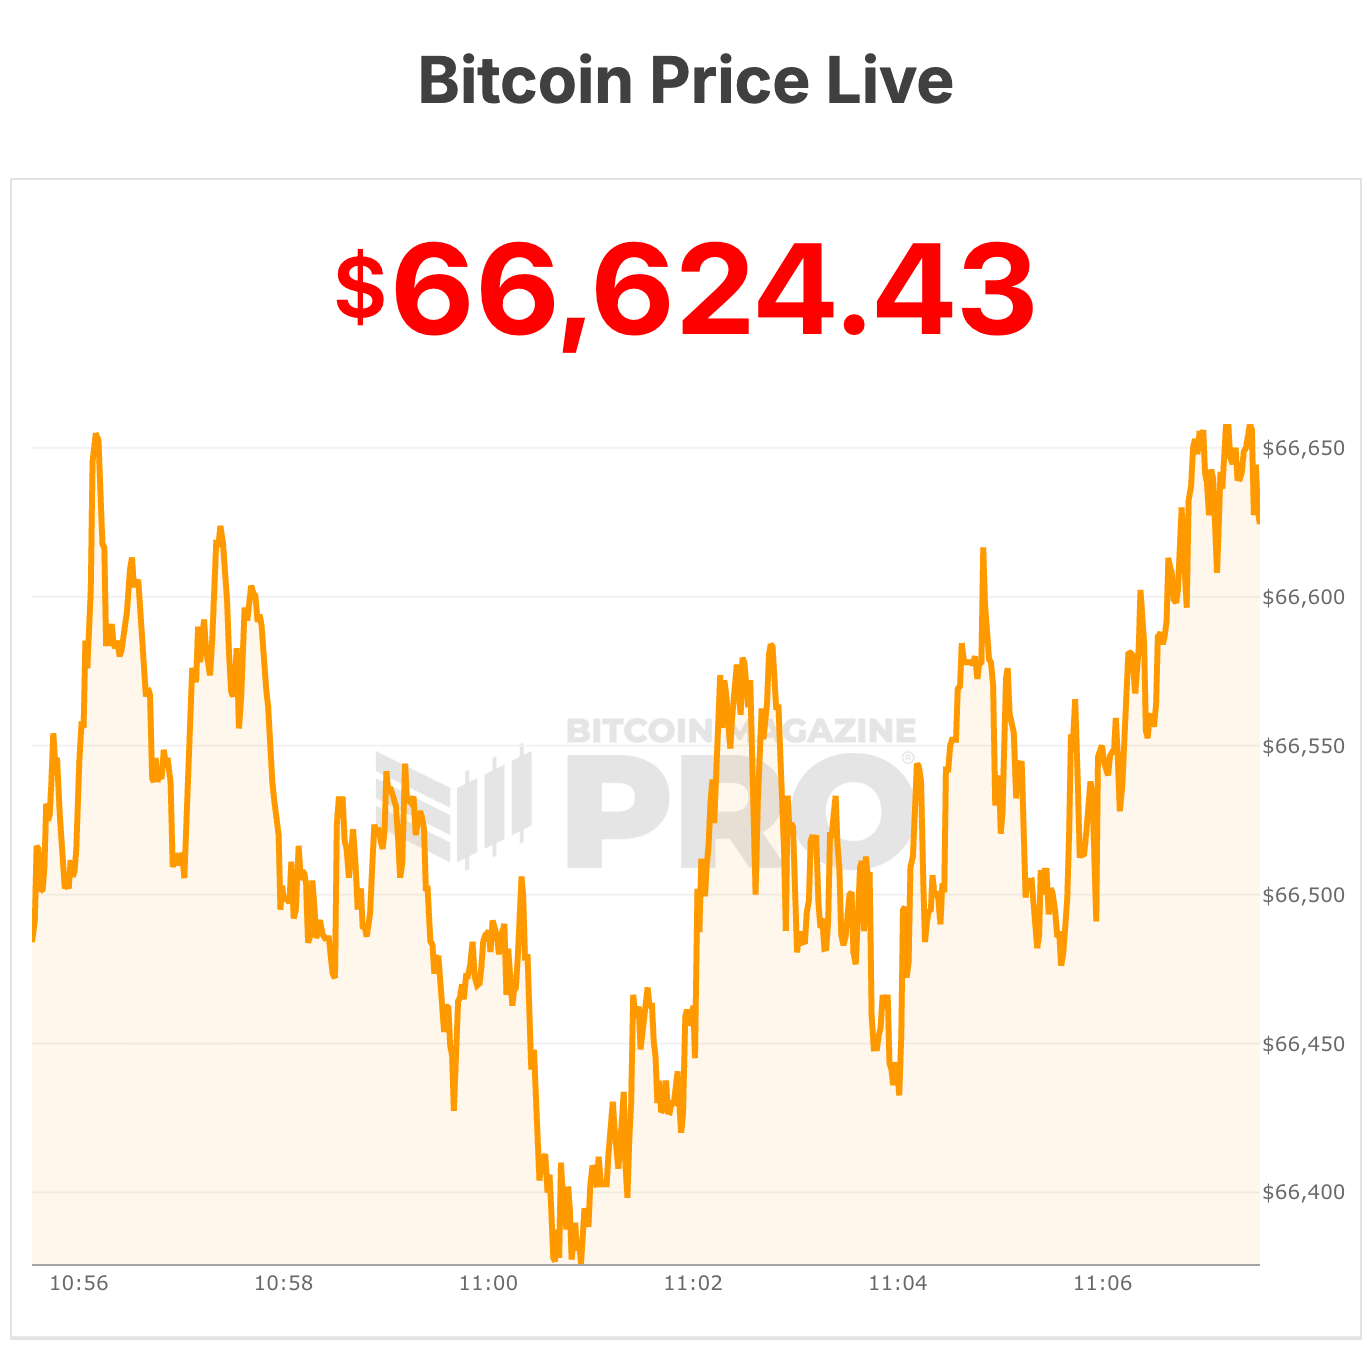
On downside bulls keep eyes peeled towards sixty-five six-fifty three thousands serving nearer term supports whereas crucial floor established at sixty grand above point-six-one-eight Fibonacci retracement fifty-seven eight-hundred based upon Bitcoin Magazine Pro data.
As per current updates presently bitcoin trades valued approximately sixtysix thousand sixhundred twentyfour.
This article titled “Bitcoin Price Approaches $60k Eyes Multi-Month Bottom” originally appeared via Micah Zimmerman publication source named “Bitcoin Magazine”.