On February 11, 2026, Bitcoin found itself balancing precariously between cautious optimism and formidable selling pressure. Valued at $67,131 with a market capitalization of $1.34 trillion, the cryptocurrency fluctuated within a daily range from $66,351 to $69,876 while experiencing a hefty trading volume of $46.24 billion over 24 hours. Despite this significant activity in volume, the overall momentum remains subdued and far from celebratory.
Bitcoin’s Market Perspective
The daily price chart reveals an unmistakable sense of broader market unease. Following a steep decline from January’s peak at $97,939 down to around $59,930, Bitcoin has been oscillating tightly between roughly $66K and $70K. The prominent high-volume red candle formed near the low of approximately $59.9K might hint at capitulation—a potential bottom—but it would be premature to declare this as a confirmed trend reversal just yet.
Resistance is looming near the critical level of about $75K; any bullish momentum must overcome this barrier before meaningful gains can be expected. Conversely, if Bitcoin dips below that crucial support zone around $59.9K again, it could signal an end to its current upward bias.
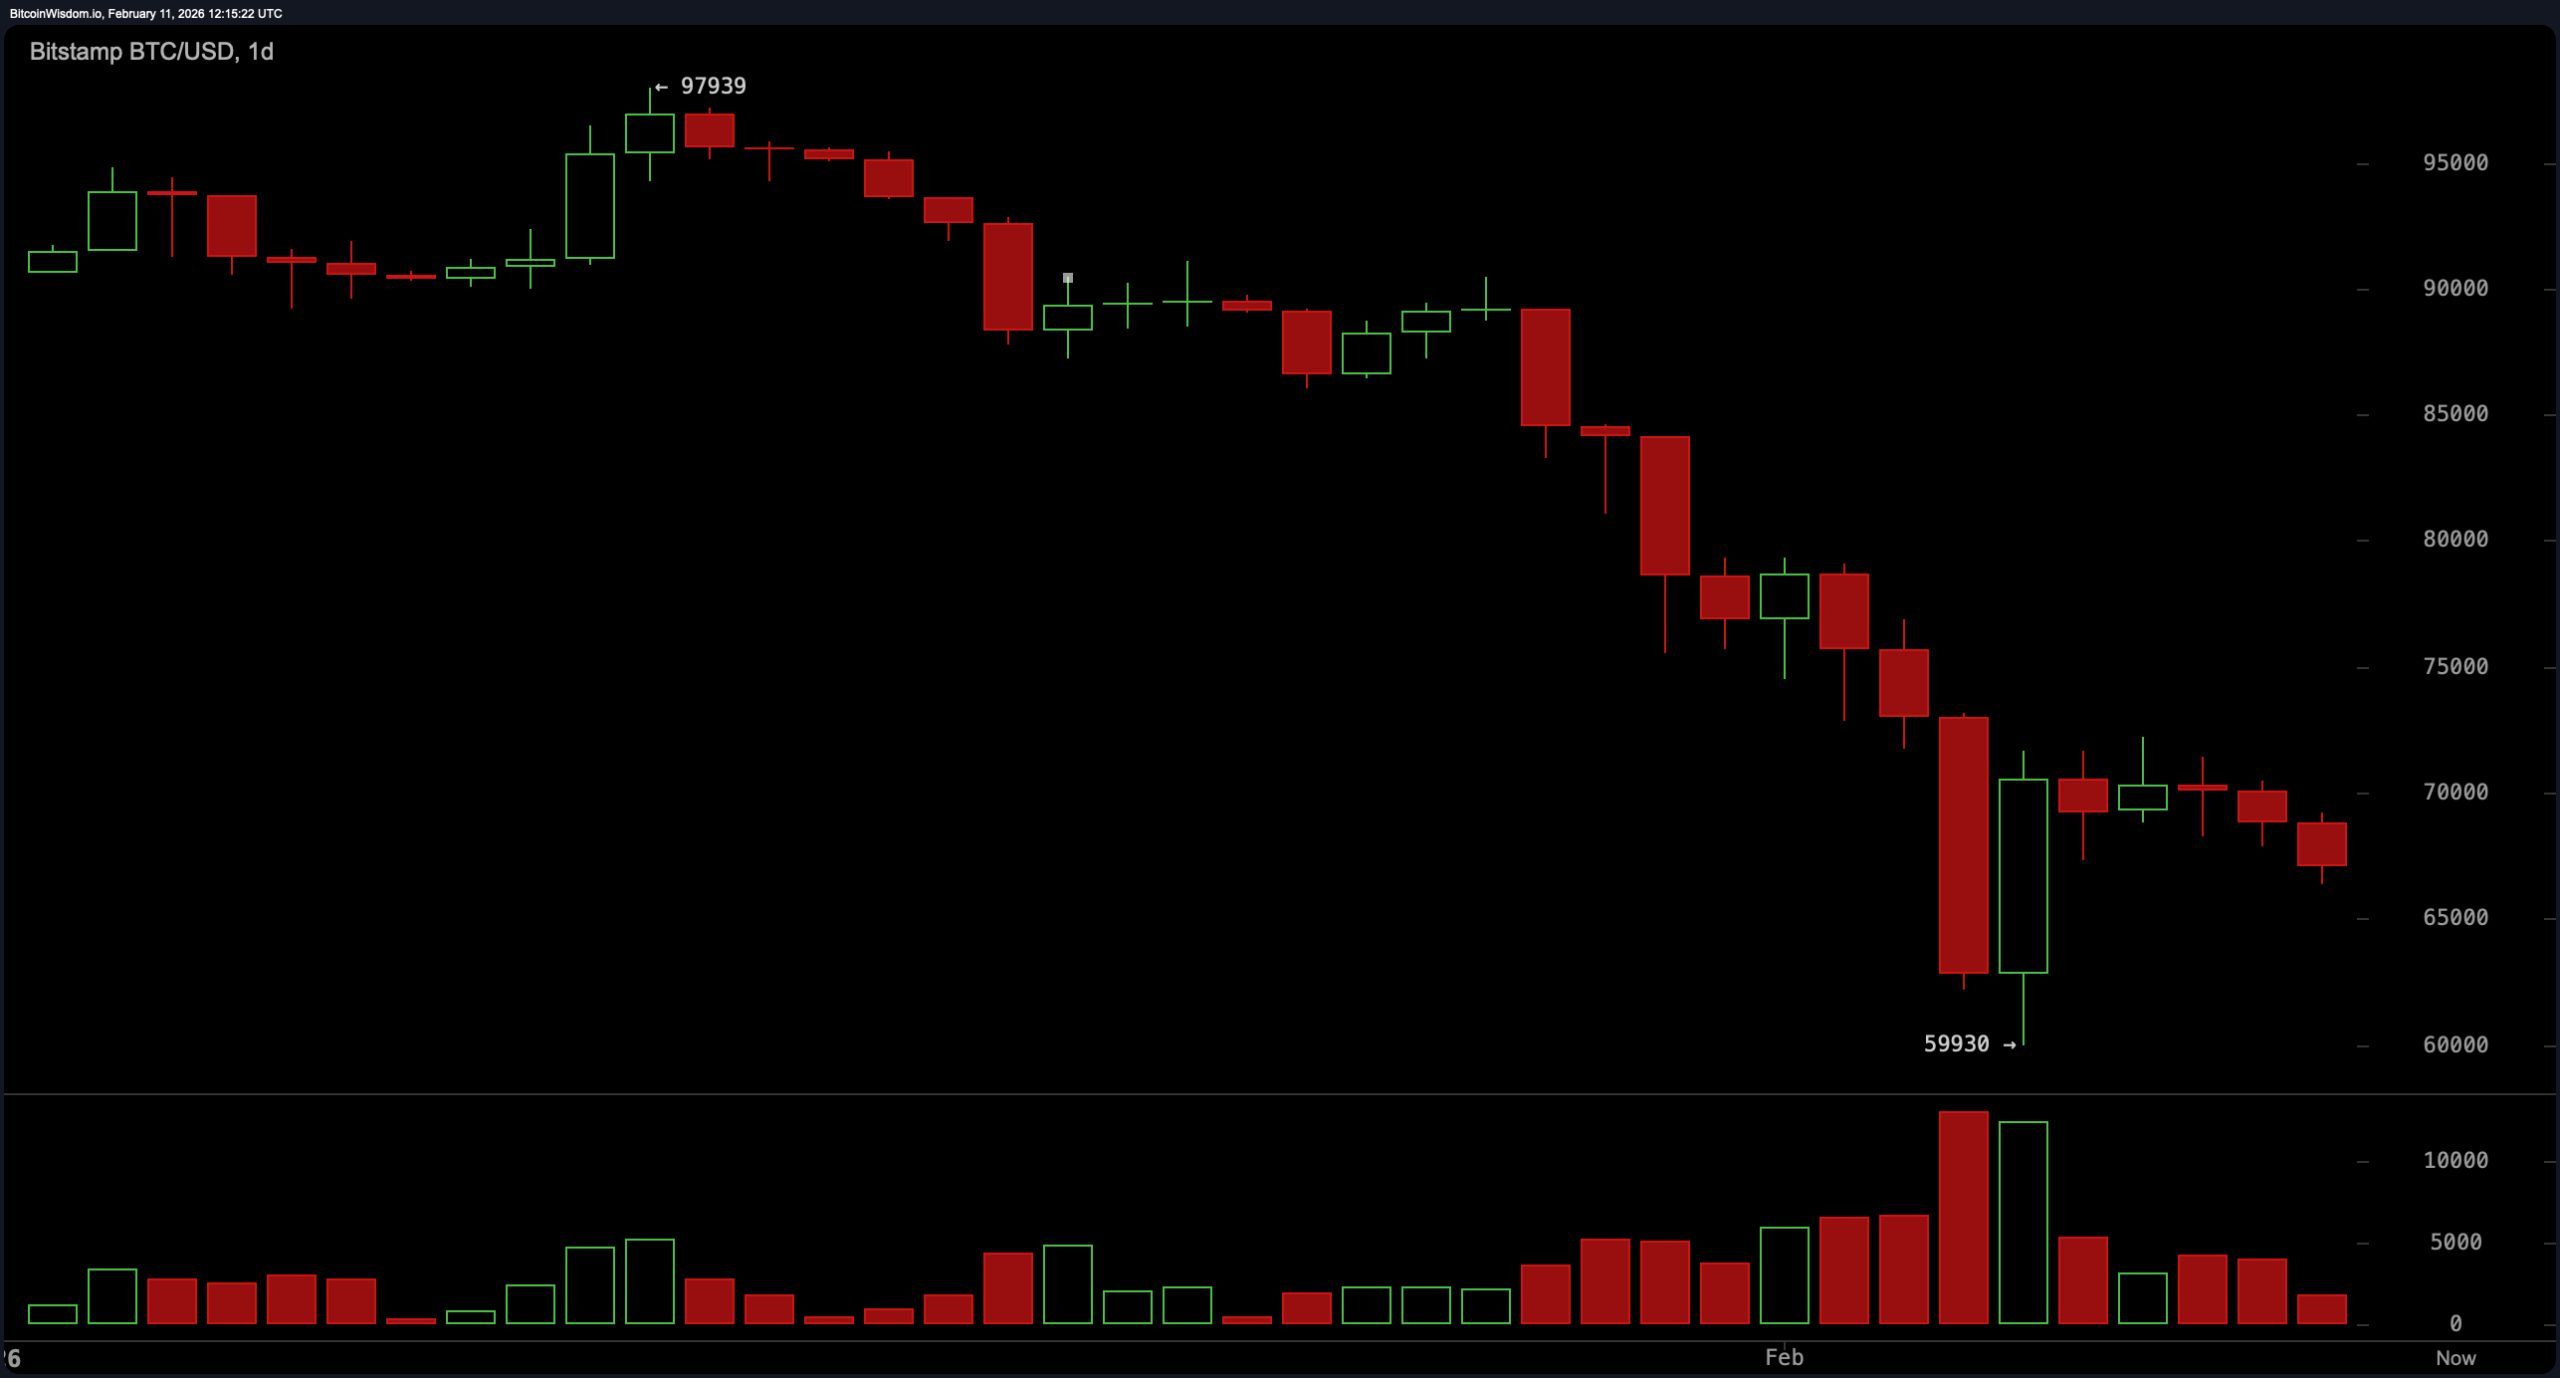
$BTC/USD daily chart via Bitstamp on Feb 11th 2026
A closer look at the four-hour timeframe paints an equally cautious picture without signs of robust recovery yet underway. The short-term trend shows lower highs paired with weak rebounds after attempts to rally from near the key support zone around$59.9K faltered recently—especially after rejection close to$72,174 on February 8 coupled with declining trade volumes.
Currently consolidating close to$67K levels means any attempt above$69K accompanied by strong volume could ignite renewed interest among traders but structural fragility persists nonetheless.
If prices fall below support at approximately$66K backed by increased selling pressure,the downside risk intensifies significantly.
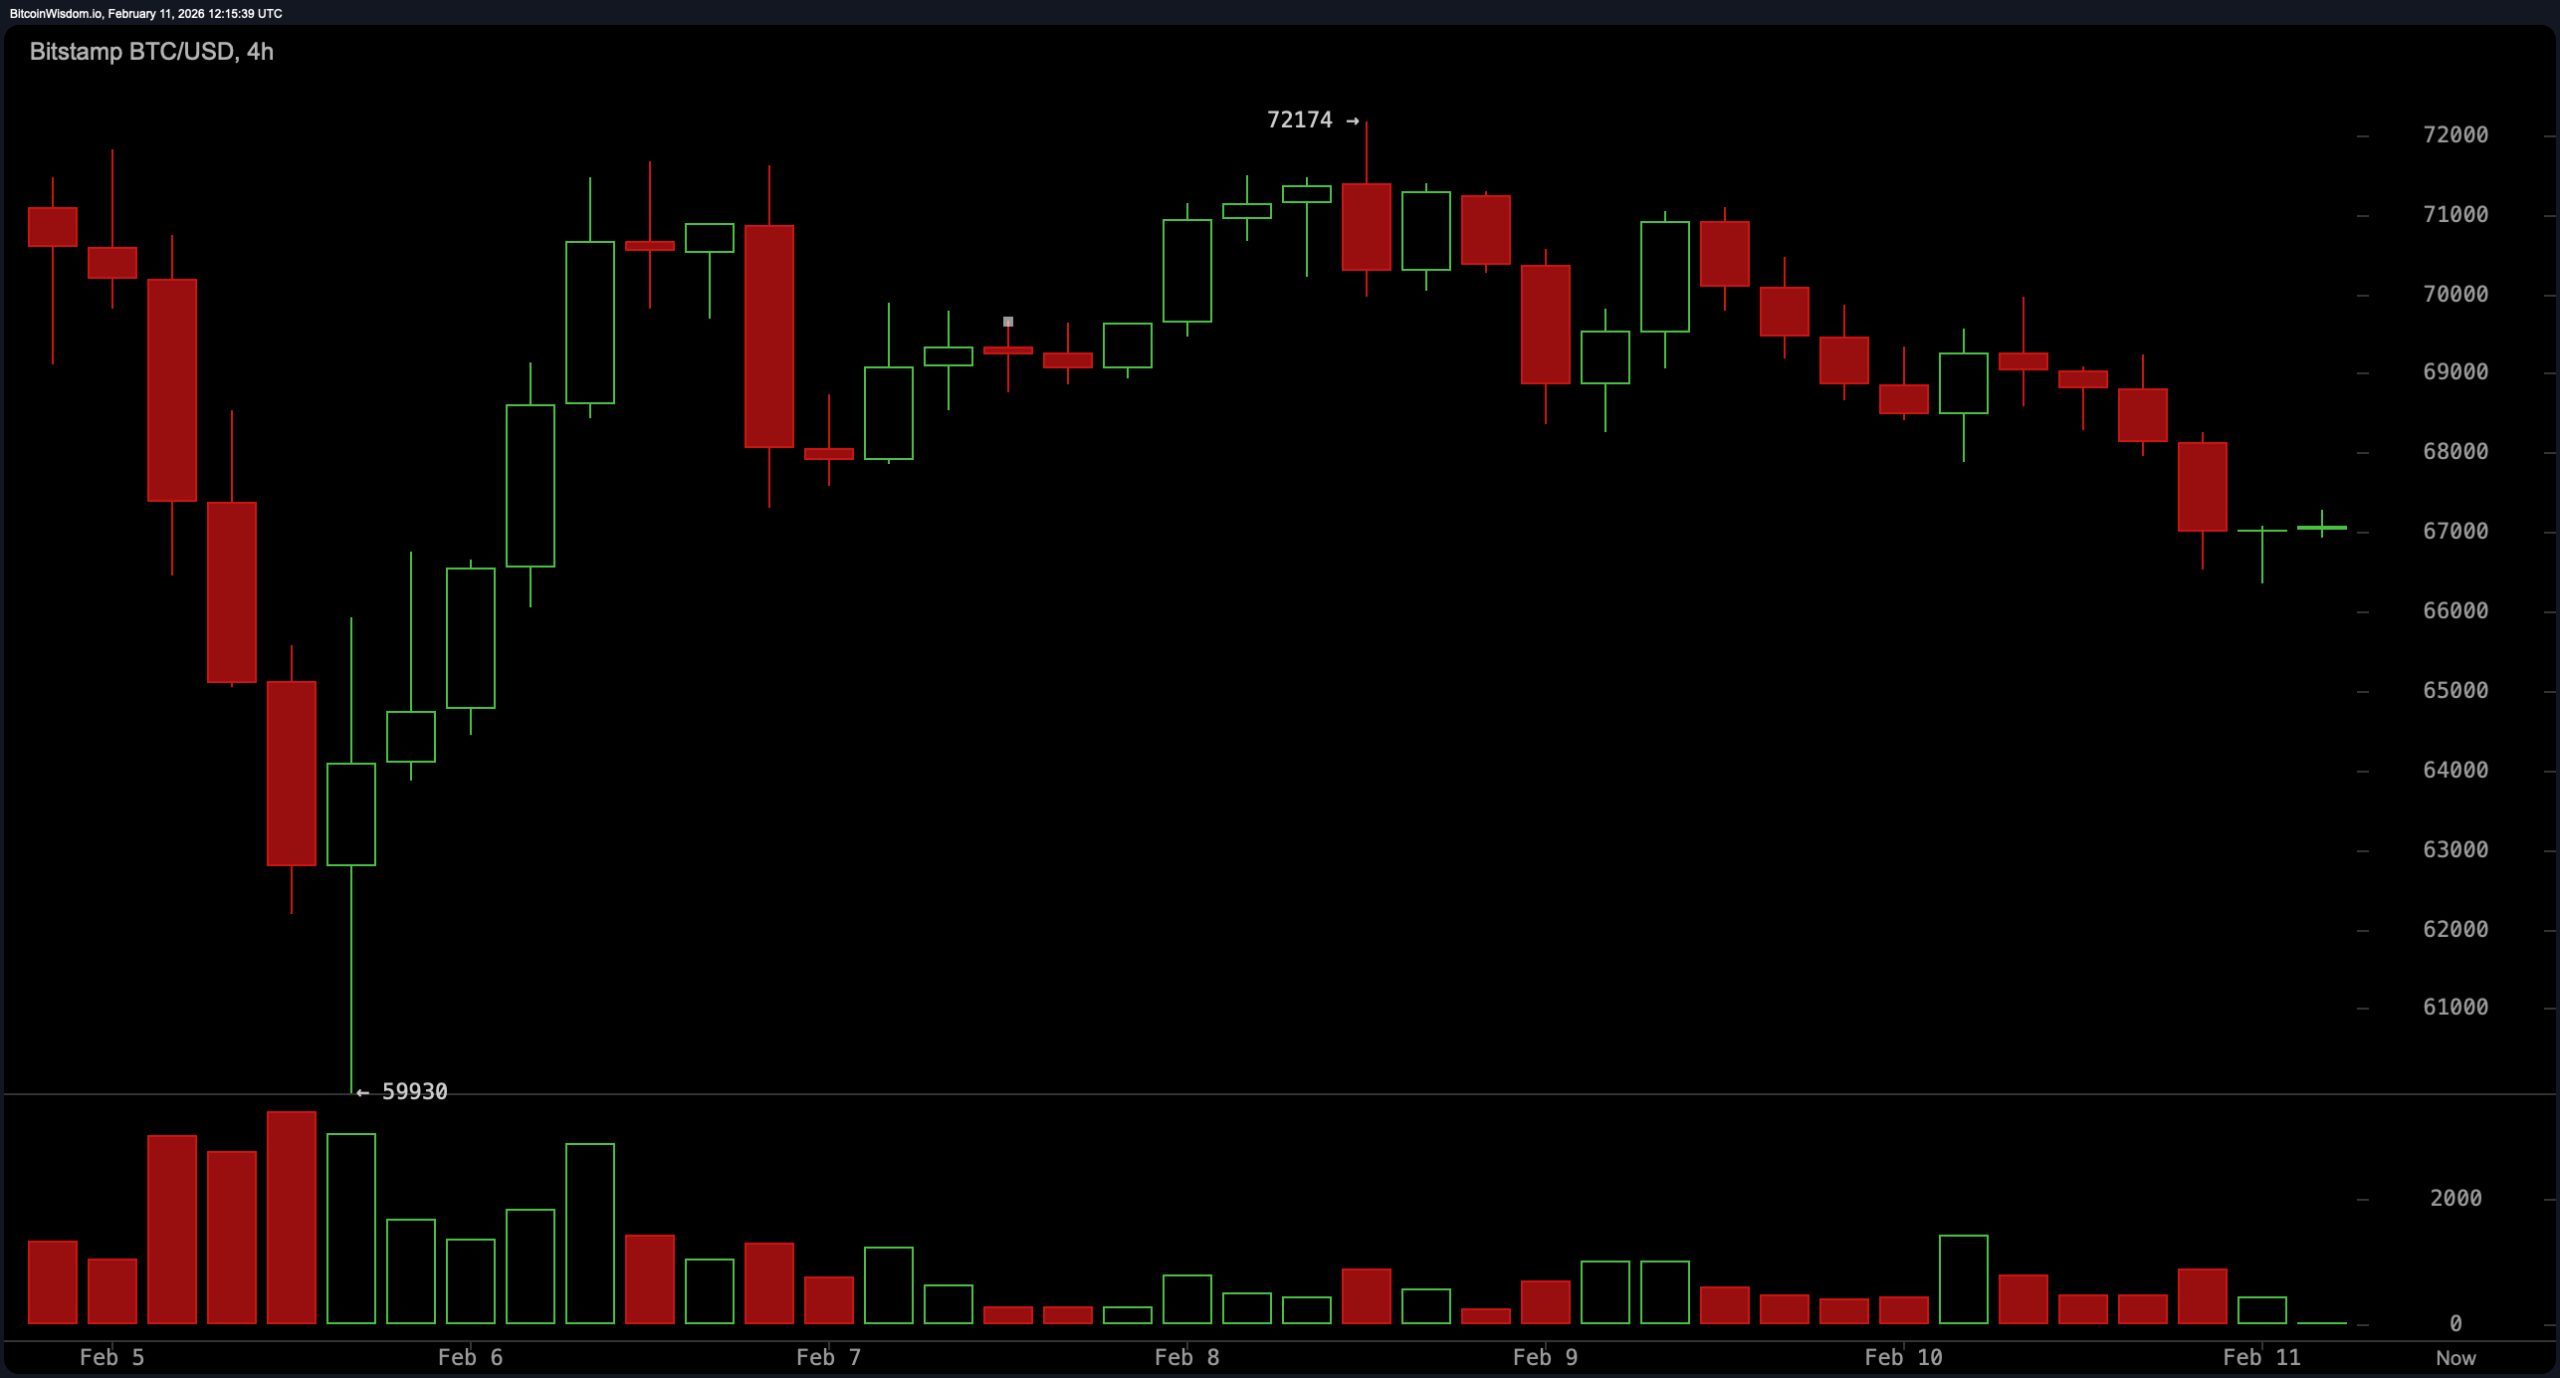
$BTC/USD four-hour chart via Bitstamp on Feb 11th 2026
The one-hour chart offers slightly more action for short-term traders but still lacks decisive strength or clarity in directionality—trading within a narrow band ranging roughly between$66.3k and$67.5k following lows near$66,351 along with muted recovery attempts marked by small green candles lacking conviction.
This sideways tug-of-war suggests that unless trading volumes surge dramatically indicating serious buying interest,a breakout either above resistance around$67,&$70k or breakdown beneath support near,$66,&$3k will determine next directional moves toward mid-$64Ks or higher targets respectively.
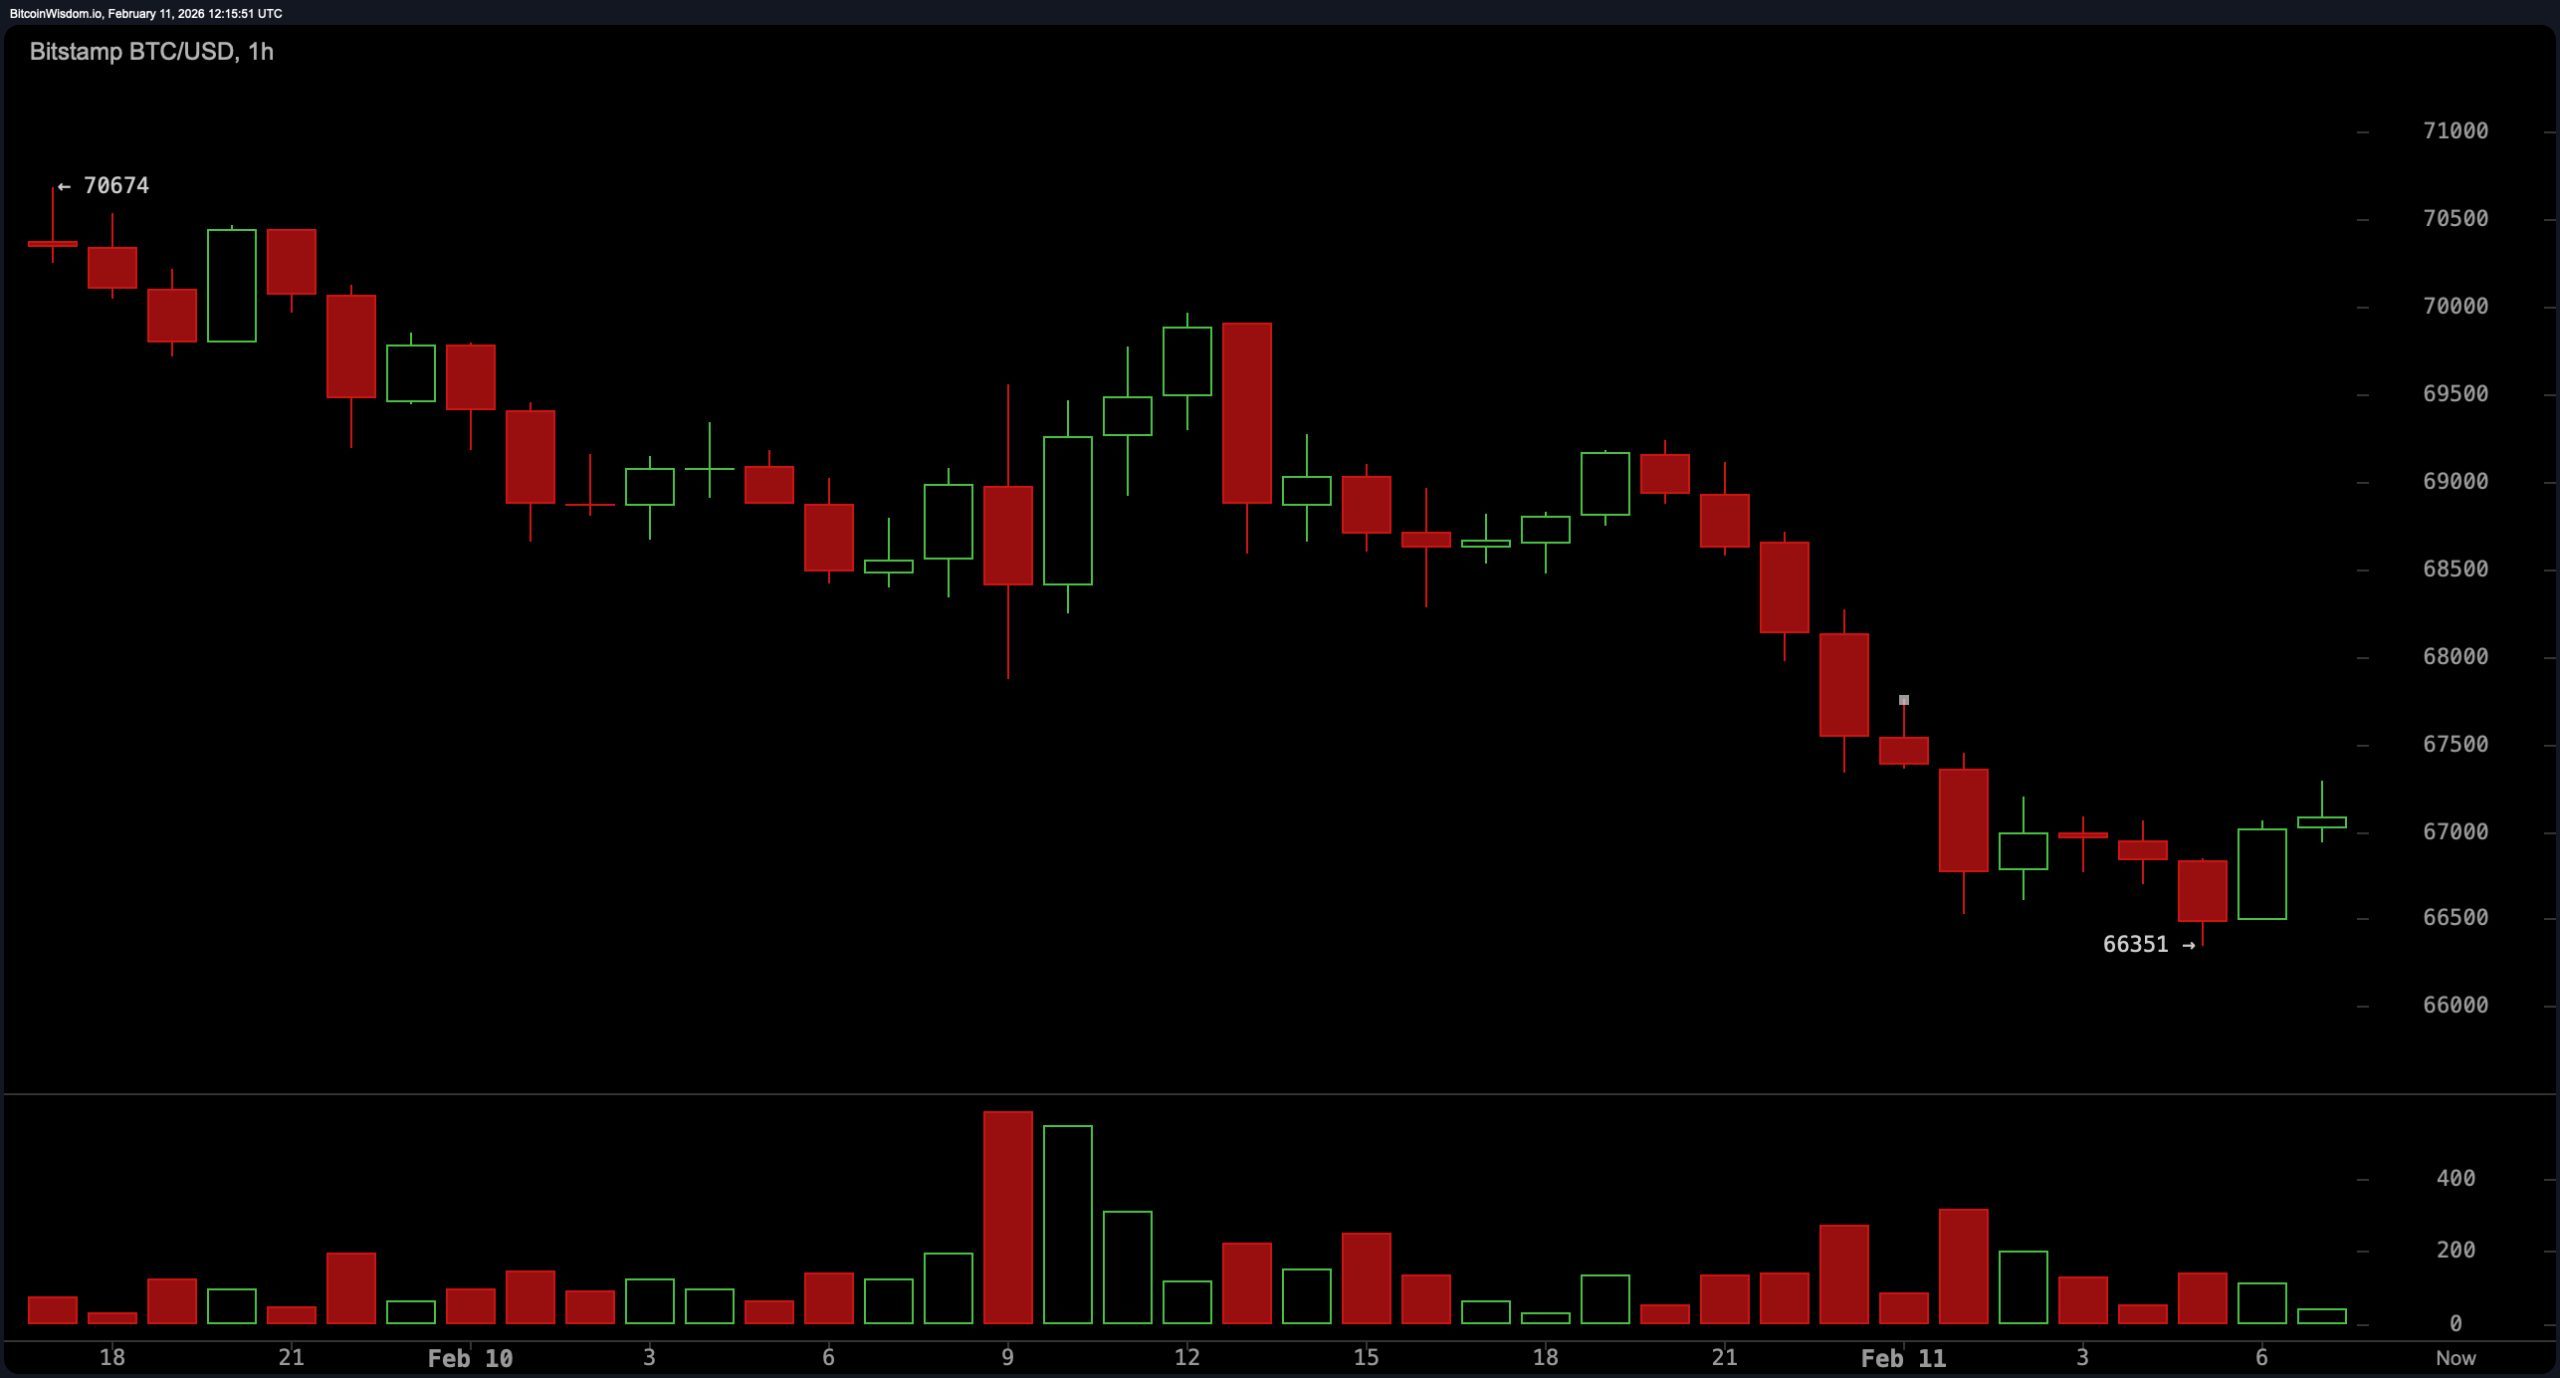
$BTC/USD one-hour chart via Bitstamp on Feb 11th 2026
Technical indicators are offering no clear celebration signals either.
The Relative Strength Index (RSI) hovers around30 while Stochastic oscillator sits just belowat29 —both technically neutral but edging toward oversold territory.
The Commodity Channel Index (CCI) remains negativenear -93,and Average Directional Index (ADX) stands firmat52 showing trend strength without favoring bulls or bears.
Meanwhile,the Awesome Oscillator stays deeply negativearound -14,&-800,and Momentum indicator also leans bearishat about -9813.
Finally,the Moving Average Convergence Divergence (MACD) reads roughly -5797,cooling down hopes for bullish continuation.
Moving averages add further gloom: e&xponentialand simple moving averages across all periodsfrom10 up through200 uniformly suggest downward pressure.
For instance,the10-period EMA is positioned well above current pricesaround71,&-449while200-period SMA looms even highernear101,&-560 —both indicating substantial distancebelow these key technical levelsand underscoring structural weakness in recent price action.
This gap implies that what appears as minor rebounds may lack real strength behind them.
Summary:
Consolidation dominates bitcoin’s current state,support zones remain vital,and any meaningful upward movement demands solid backing through increased trading volume.
Until such confirmation emerges,traders should maintain tight stop-lossesand keep expectations realistic.
Bullish Scenario:
if bitcoin managesto holdthe importantsupportlevelaround66000andsuccessfullybreakabove69000withsignificantvolume,itcouldtriggerashort-termrecoverytowards72000andpotentiallychallenge75000resistanceagain.
Thehigh-volumebottomformationnearthe59900markmightrepresentacapitulationpointsuggestingtheearlystagesofabottomingprocessalthoughthisremainsfragileandunconfirmedyet.
Bearish Scenario:
thedominanttechnicalpictureremainsbearishwithpricesconsistentlytradingbelowmajormovingaveragesandonmomentumindicatorsprovidingnolendinghandtobulls
Abreachbelow66000andsubsequently59900wouldlikelyconfirmcontinueddowndraftsettingthestagefordeeperdeclinesandalongercorrectionphaseahead
Frequently Asked Questions ❓
What’s bitcoin’s current price?
AsofFebruary112026bitcoinisvaluedatapproximately6700
Isbitcoininuptrendordowntrend?
Bitcoincurrentlyexperiencesamacrodowntendcharacterizedbyweakshorttermrebounds
W ;hereissupportforbitcoin?
Keysupportlevelsareidentifiedaround6600060
W ;hatresistancelevelsdoesbitcoinface?
Thecryptocurrencyencountersresistancenear690006900aswellastrongerbarrierclose750007500