Bitcoin remains locked in a fierce battle against downward pressure following a steep drop from its all-time peaks. As of February 8, 2026, the cryptocurrency is valued at $70,854, with a market cap reaching $1.41 trillion and daily trading volume hitting $50.09 billion. Throughout the day, prices fluctuated between $68,443 and $70,976—oscillating wildly like an energized pendulum amid turbulent market conditions.
Bitcoin Price Analysis
The daily chart paints a picture of severe distress for Bitcoin’s price action. Earlier this year, it plunged approximately 37% from nearly $95,000 down to around $59,930—shattering key support levels and crushing investor confidence along the way. Although there has been some recovery since then, the overall trend remains decidedly bearish: characterized by descending peaks and troughs alongside heavy selling volumes colored in red on charts.
This downturn wasn’t driven solely by retail panic; forced liquidations exceeding one billion dollars combined with macroeconomic uncertainties intensified selling pressure significantly. Until Bitcoin manages to reclaim and maintain territory above the critical threshold of $75,000 sustainably, this recent rally should be treated cautiously as potentially temporary.
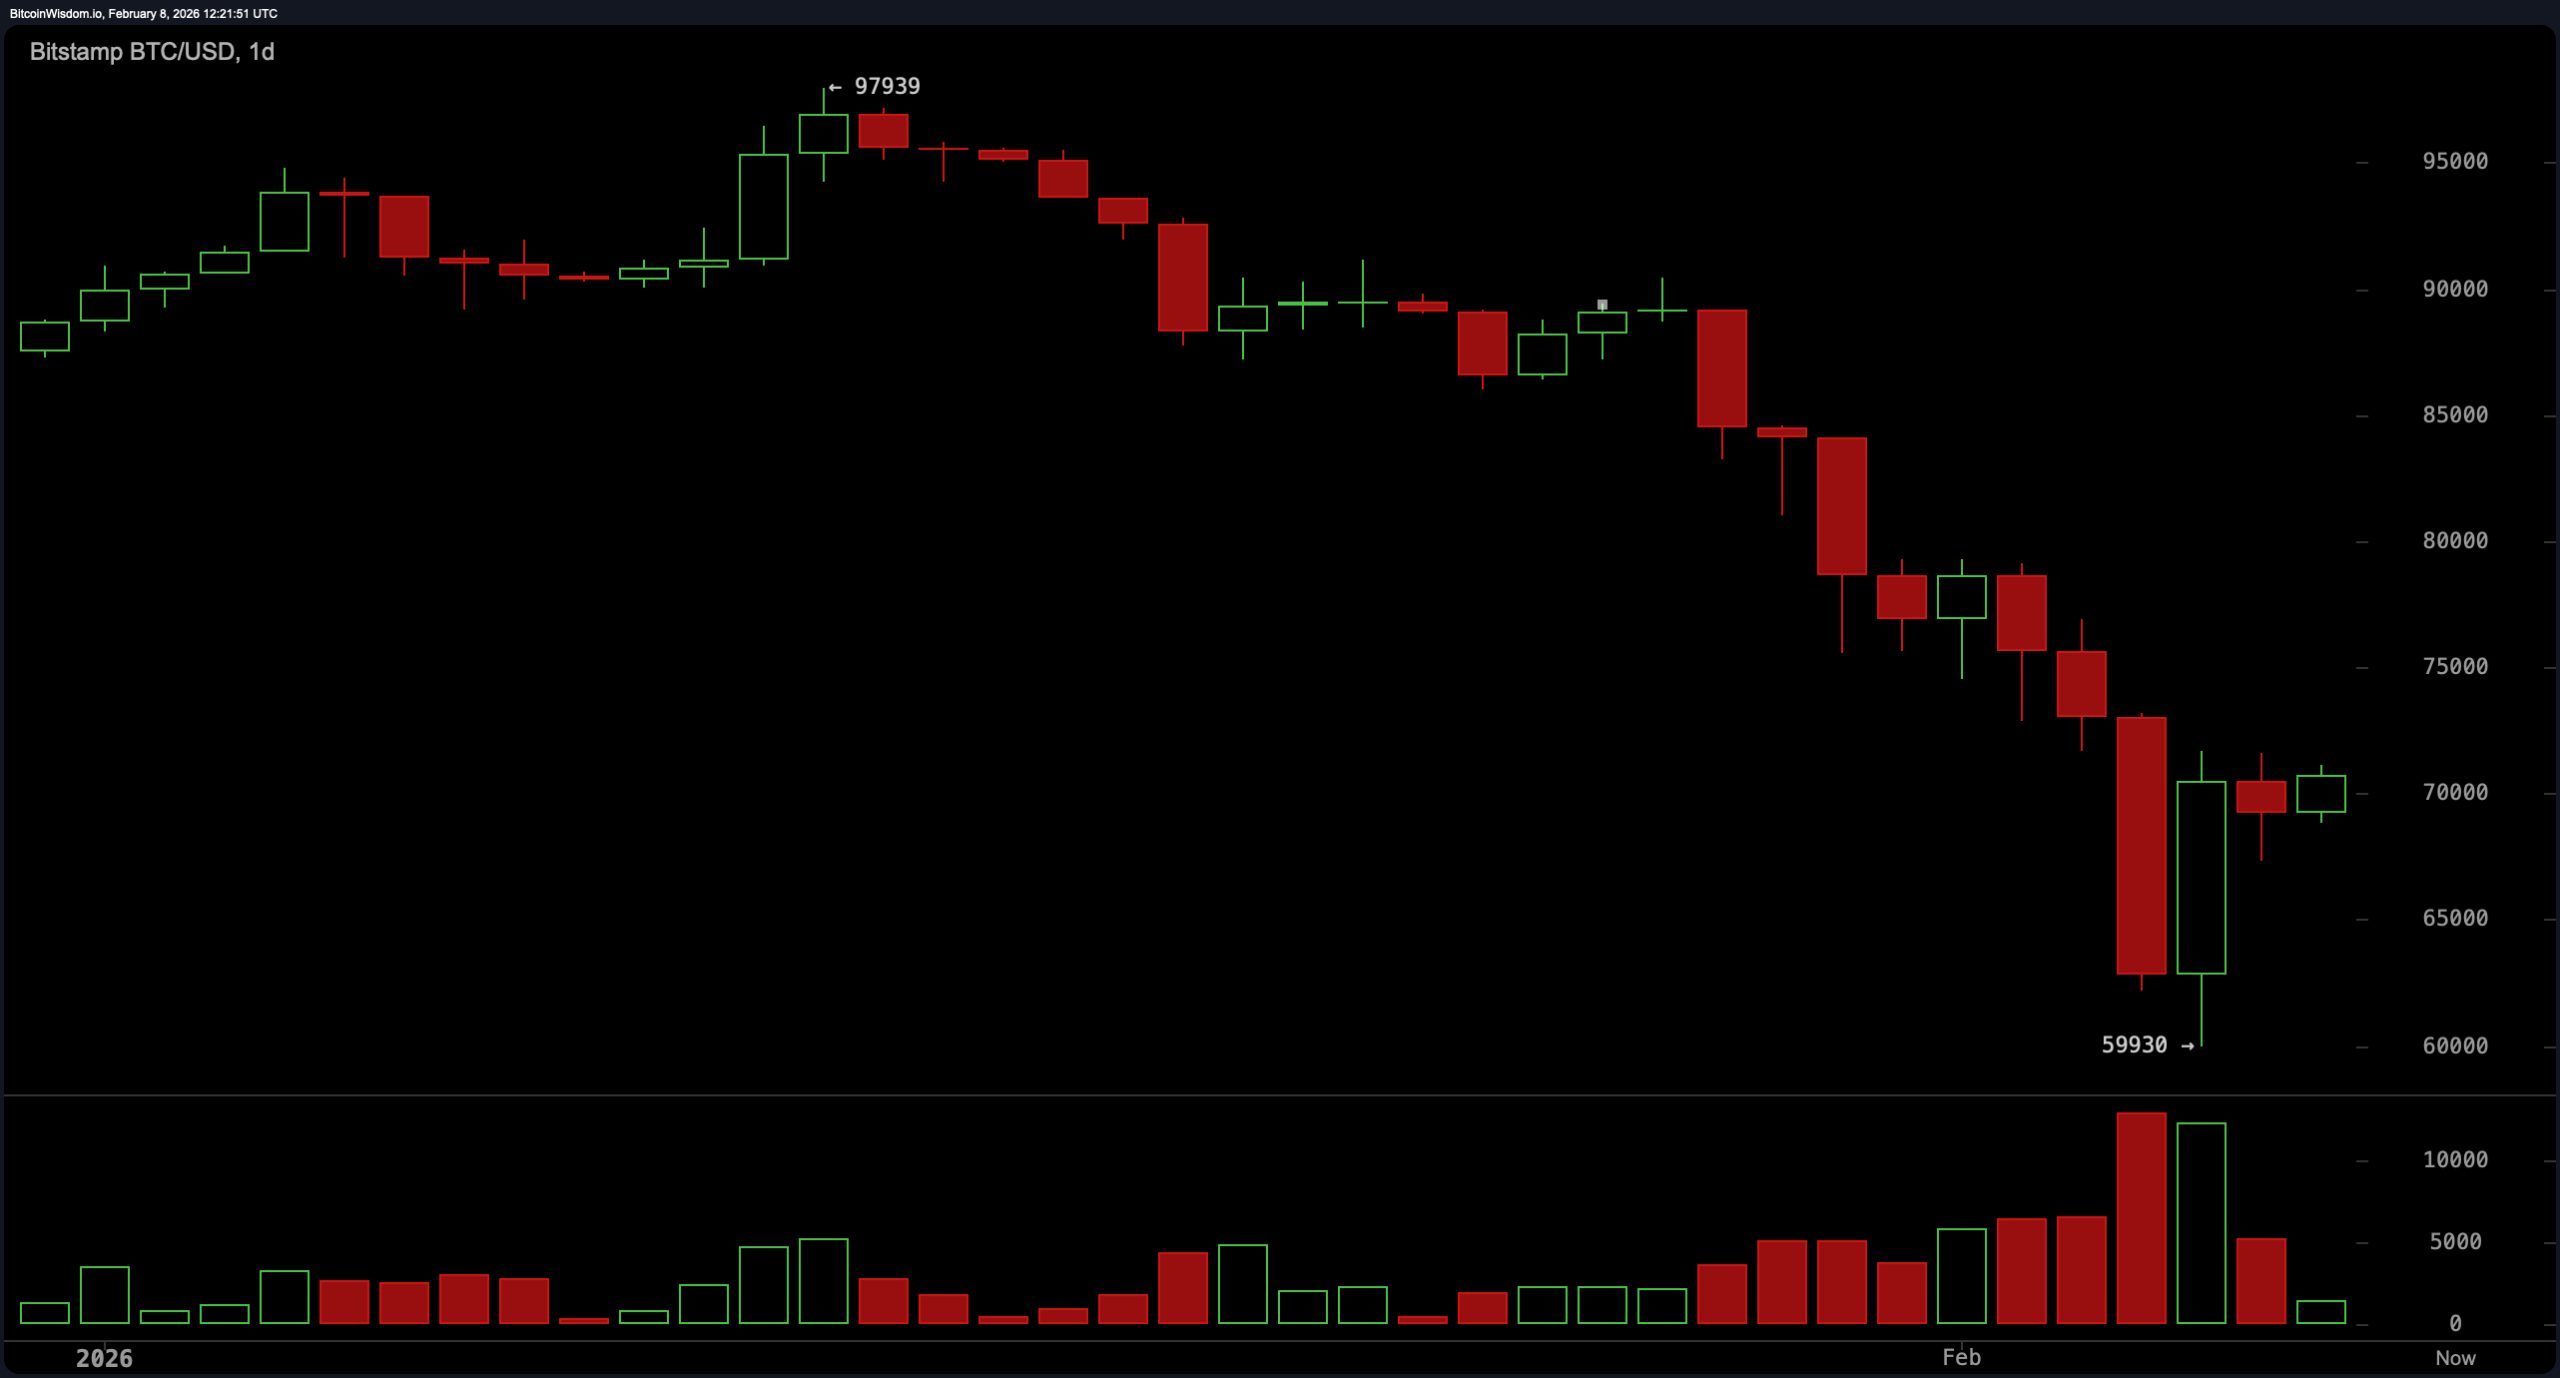
$BTC/USD daily chart via Bitstamp on February 8th 2026.
Examining shorter timeframes reveals even more hesitation in recovery attempts. On the four-hour chart, BItcoin struggles to hold above crucial levels near $70K—a zone that now feels more like contested ground than solid support. Institutional sell-offs coupled with adjustments in mining difficulty have failed to provide stability so far.
Candlestick patterns illustrate repeated efforts at rebounds quickly met by rejection pressures — painting an uncertain scenario where traders are torn between fear-induced selling or cautious buying. If you’re considering entry points around$60K–$62K ranges, watching volume closely will be essential for spotting genuine interest versus fleeting spikes.
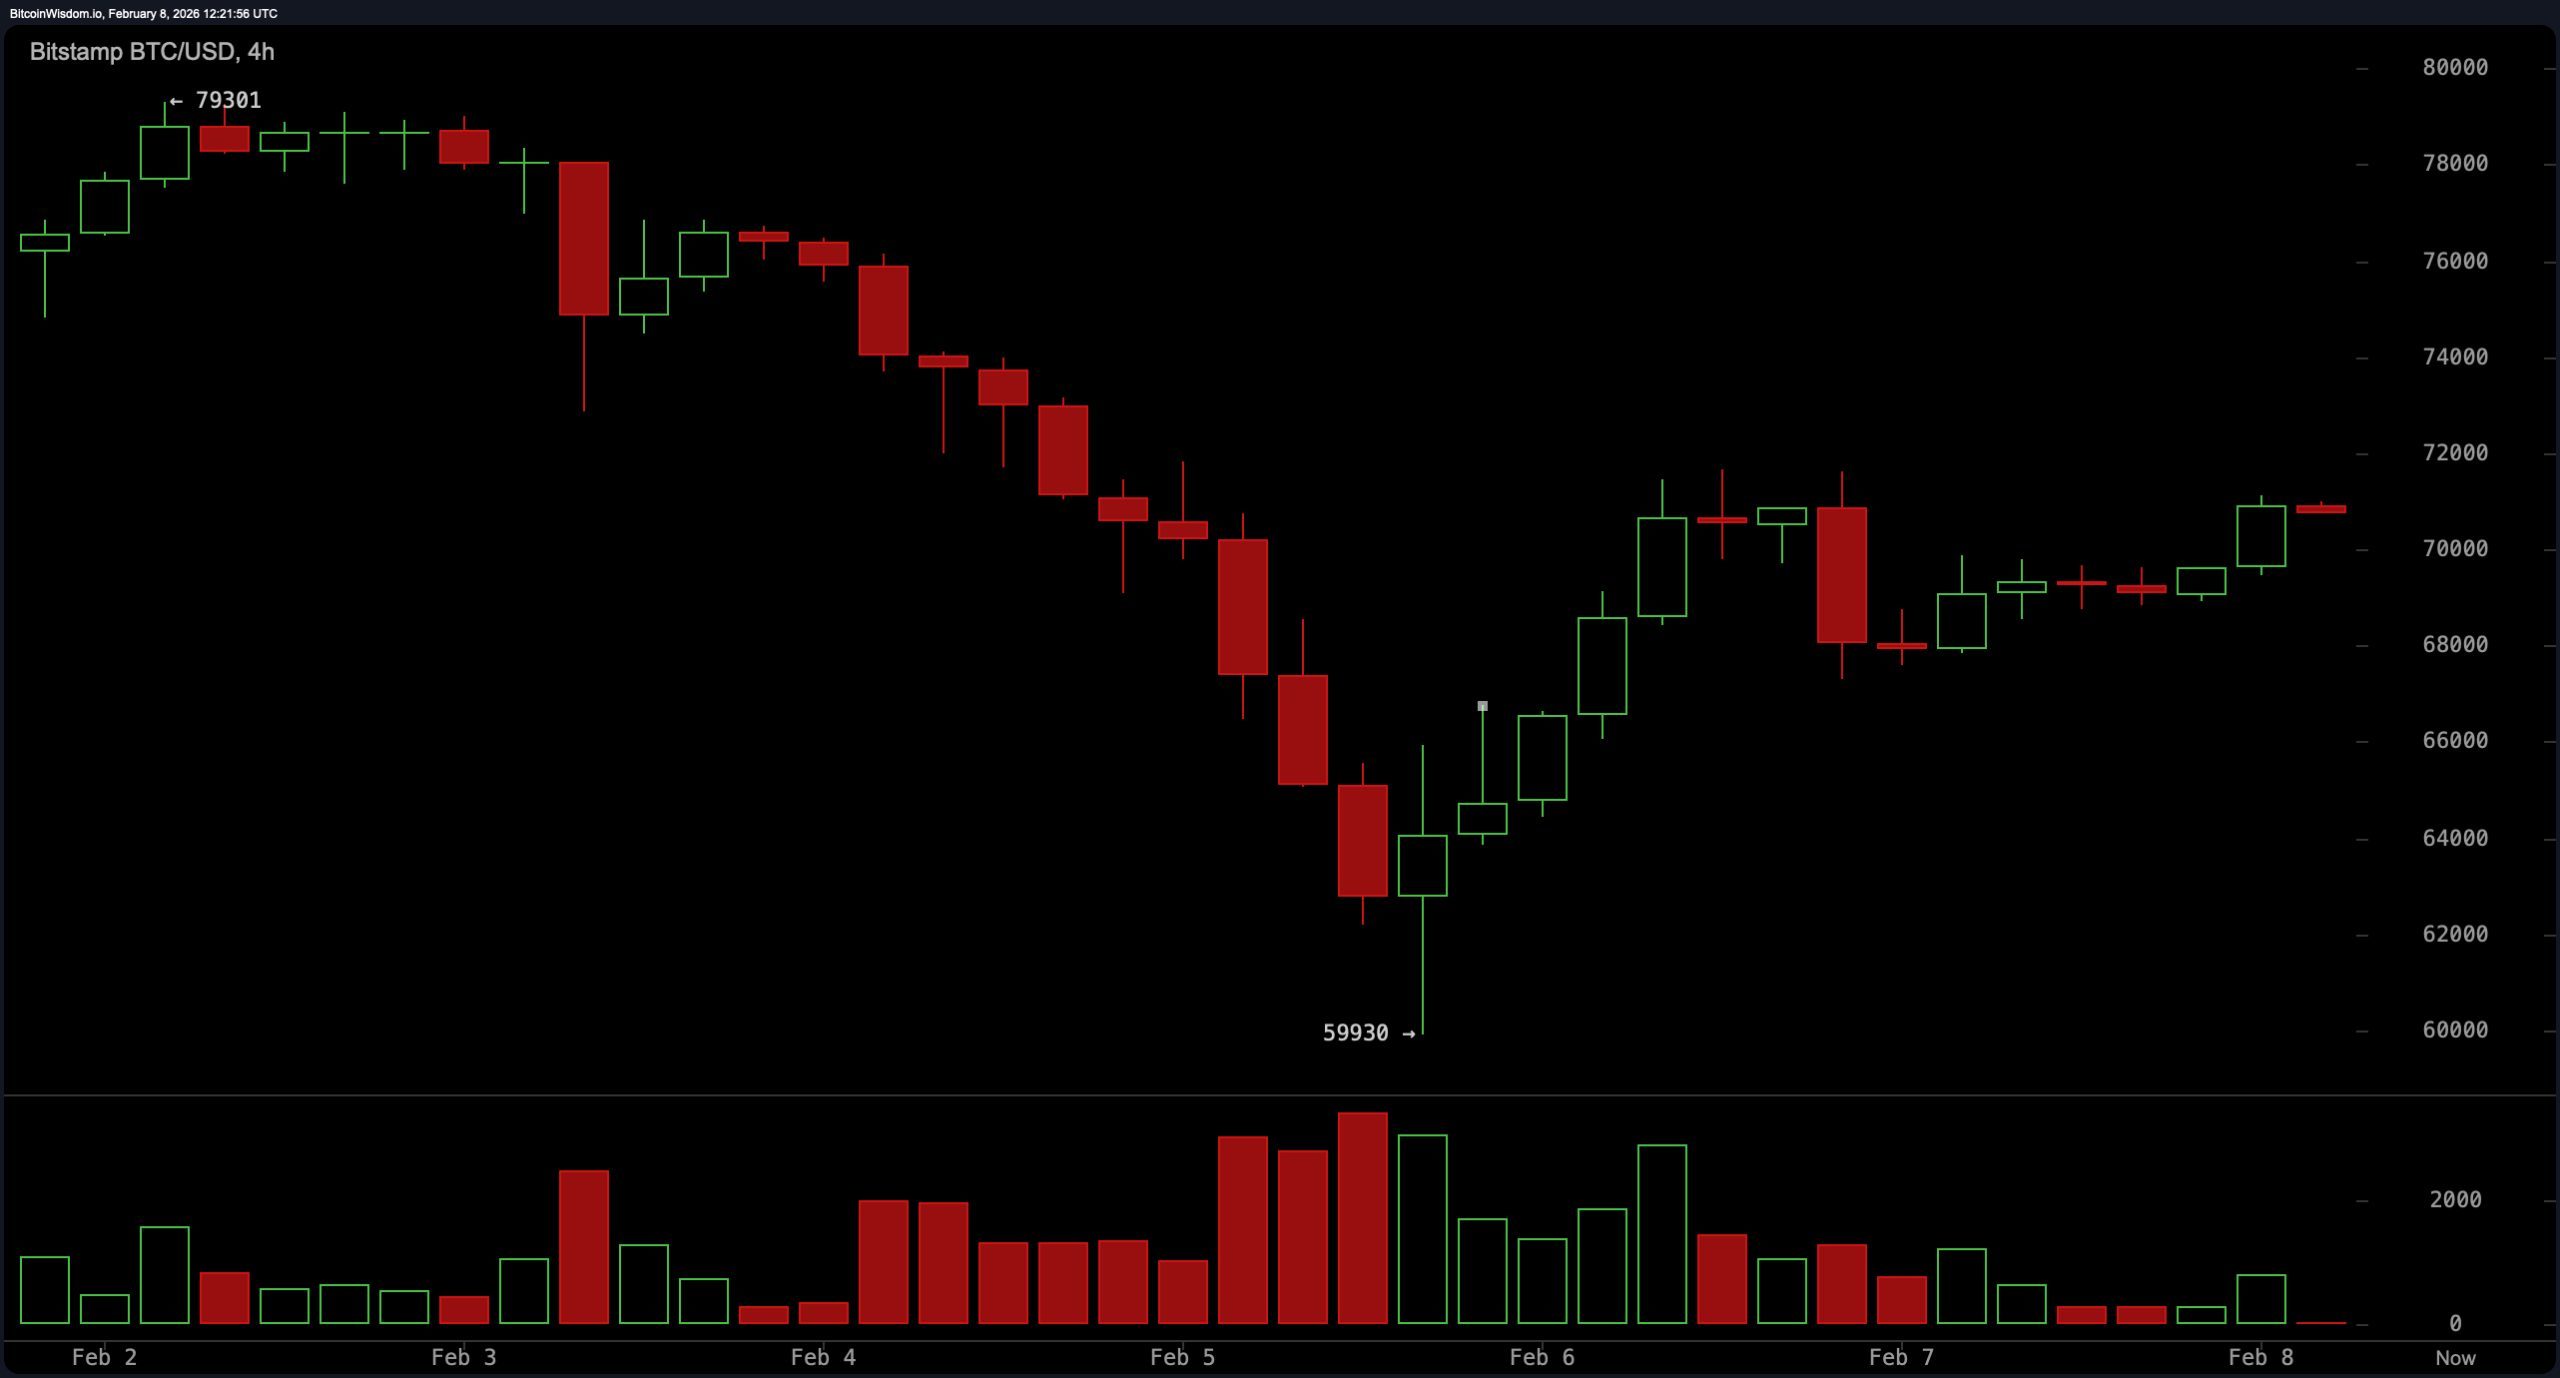
$BTC/USD four-hour chart via Bitstamp on February 8th 2026.
The hourly perspective offers slight optimism amid short-term fluctuations: Bitcoin rallied sharply from roughly$67,313 up close to$71, 673 suggesting active dip-buying or speculative positioning.
A sequence of higher lows confirms bulls nibbling cautiously but resistance near$71, 673 remains pivotal.
Clearing this barrier decisively could propel prices toward ~$74, 000 but failure risks exhaustion signals—and dropping below ~$68, 000 might open doors back down toward previous lows near ~$59, 930.
Fasten your seatbelts accordingly!
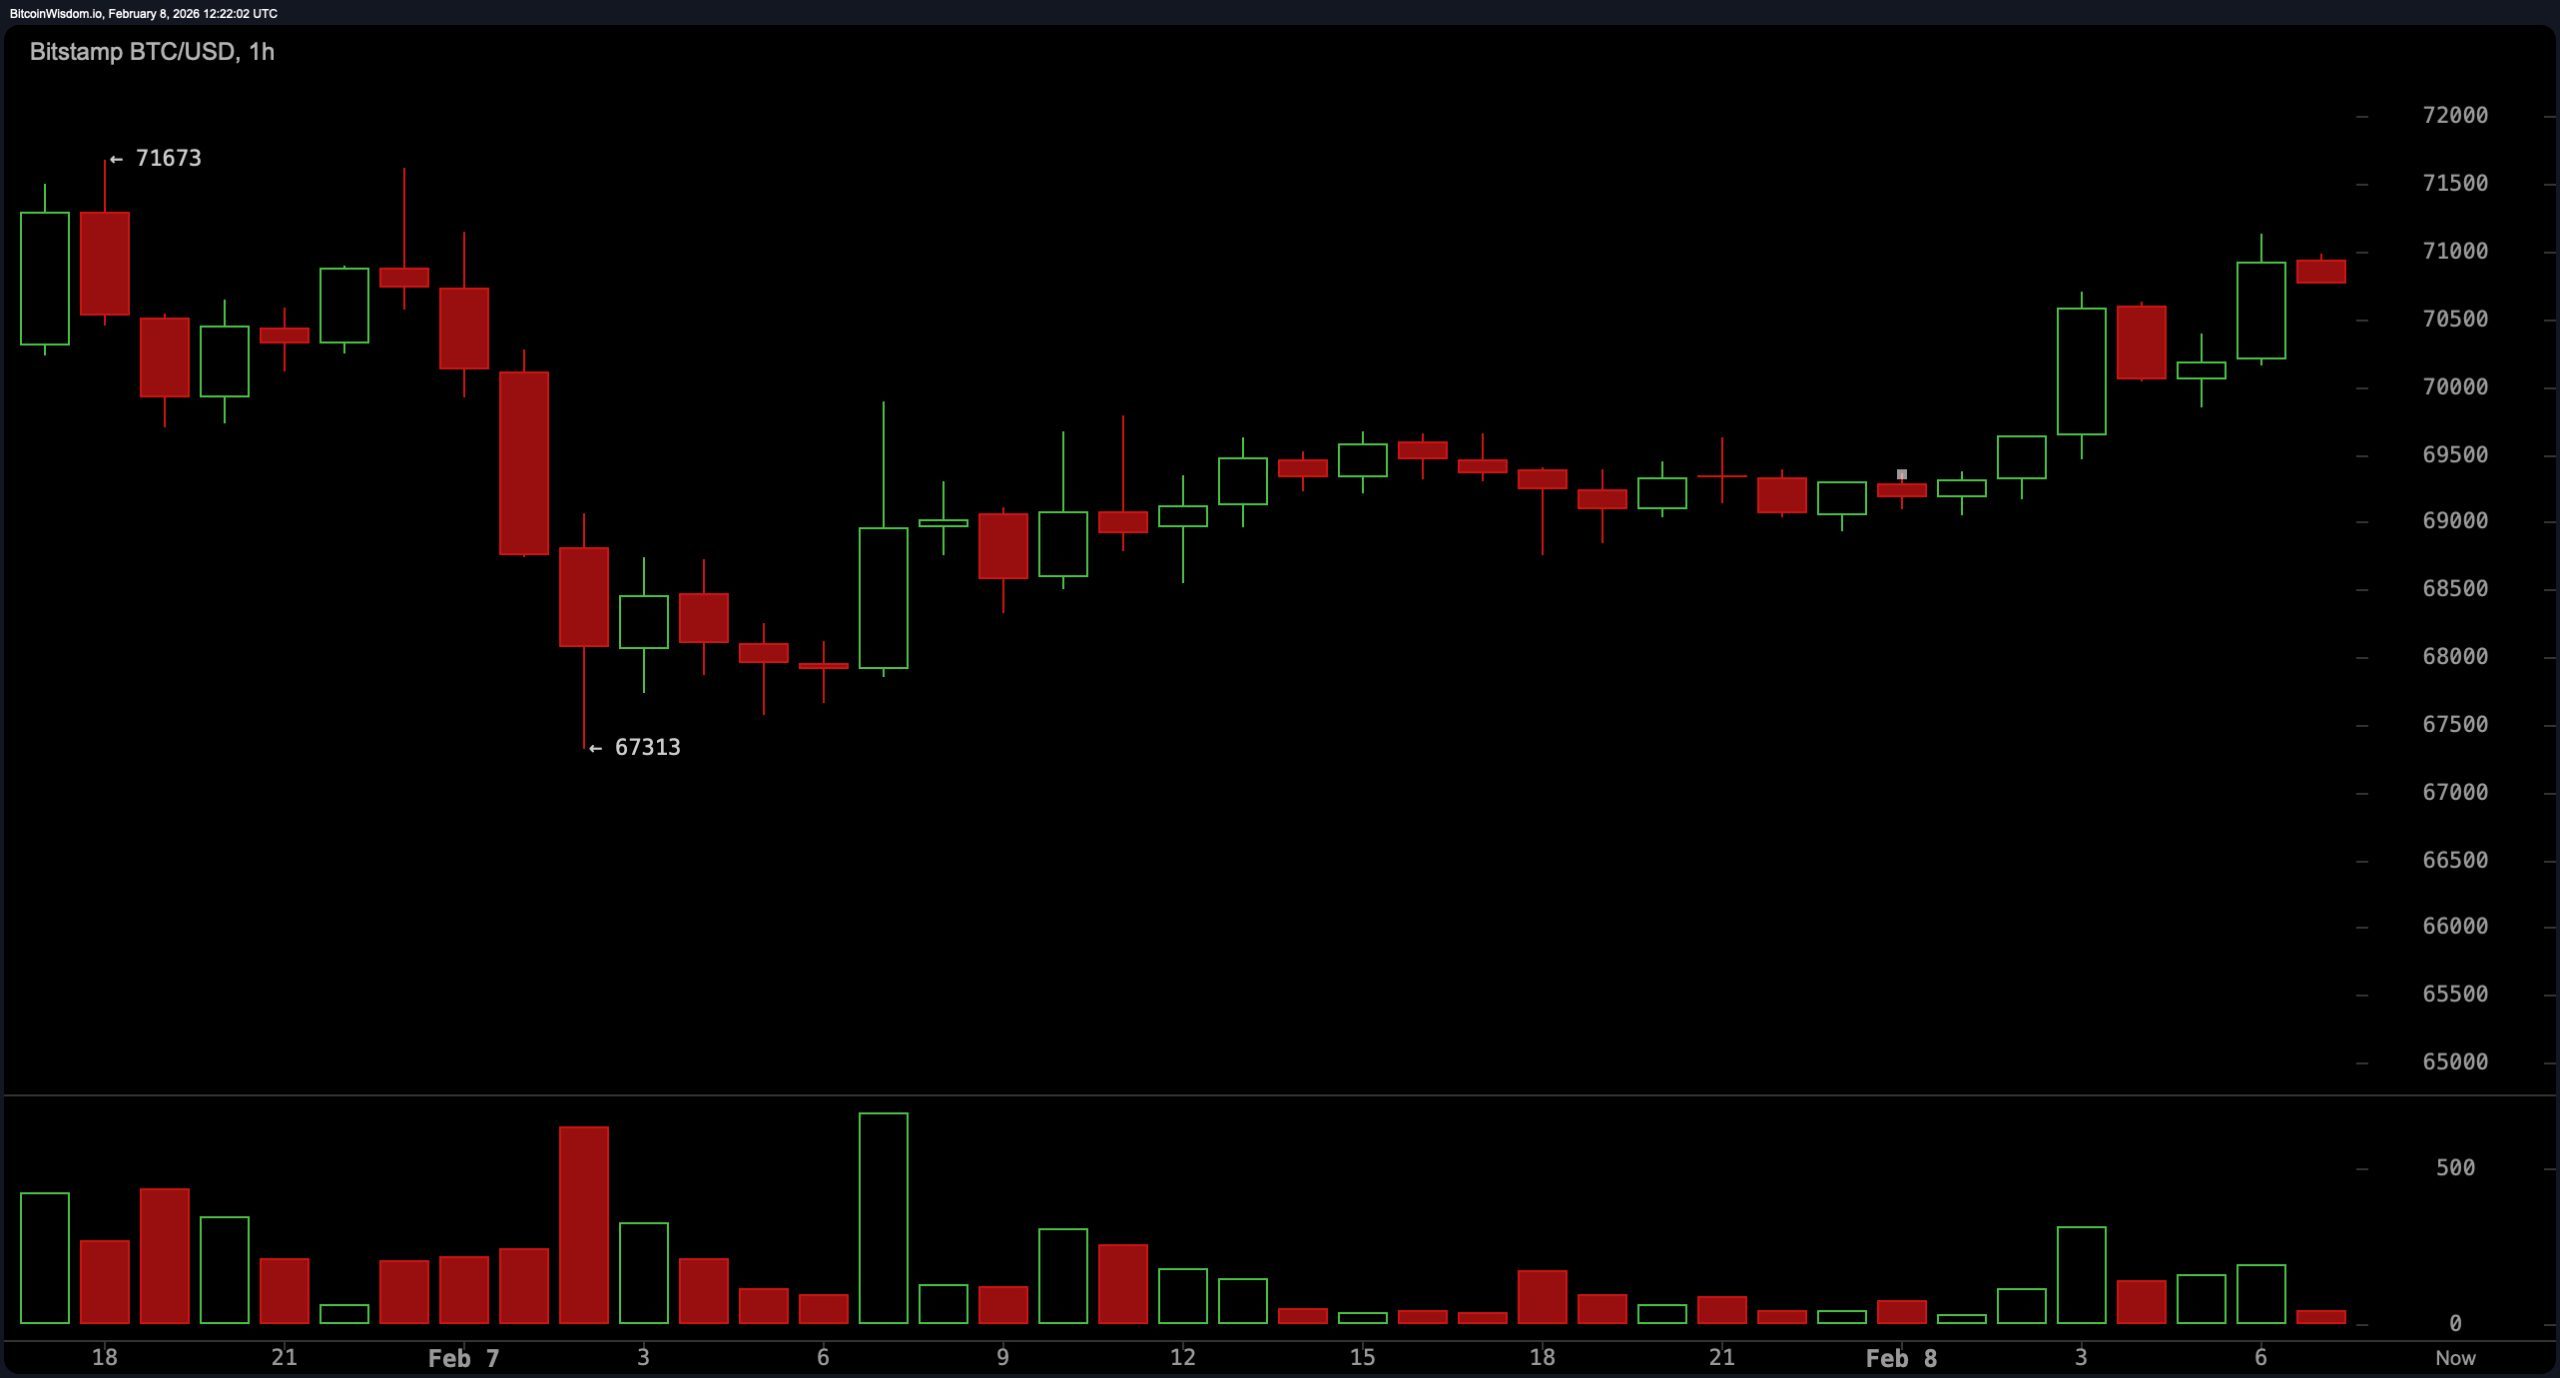
$BTC/USD one-hour chart via Bitstamp on February 8th 2026.
Technical indicators offer mixed signals without much enthusiasm: oscillators such as RSI (Relative Strength Index), stochastic oscillator,C Commodity Channel Index (CCI), Average Directional Index (ADX), and Awesome Oscillator mostly display neutral readings right now.
Momentum hints at mild encouragement but MACD (Moving Average Convergence Divergence) leans bearish signaling ongoing caution among traders.
The moving averages across various periods—from short-term10-periods up through long-term200-periods—including both Simple Moving Averages(SMA) &&&&&&, Exponential Moving Averages(EMA)—are consistently pointing downward like warning lights flashing red throughout cockpit instruments during turbulence ahead.
In summary,BItcoin’s current price behavior resembles an emotional rollercoaster filled with panic-driven drops followed by tentative recoveries yet clouded by uncertainty.
All technical evidence suggests we are witnessing a battered asset struggling against historic resistance zones amidst broader macroeconomic pessimism.
The market shows signs of life,but whether this is sustainable rebound momentum or merely twitchy reflexes remains unclear.
One thing is certain:this isn’t reminiscent of past exuberant bull runs beloved by many investors anymore.
Bullish Perspective:
if bitcoin can break convincingly above resistance level at $71,,673 accompanied by strong trading volume, a push towards&$74&comma ,000 or even higher targets near&$79&comma ,000 becomes plausible.
Short term momentum appears quietly shifting upward while formation of higher lows within hourly timeframe indicates bulls remain present though cautious awaiting confirmation triggers.
Bearish Outlook:
// All major moving averages including simple & exponential versions continue pointing lower while MACD stays entrenched below zero line indicating persistent downside bias.
This recent bounce may prove nothing more than temporary dead cat bounce fueled briefly by speculative caffeine rush rather than fundamental strength.
Unless bitcoin reclaims territory beyond&$75&comma ,000 sustainably,the prevailing downtrend dominates leaving possibility open for retesting support levels around&$60&comma ,000 again significant risk factor.
Frequently Asked Questions ❓
Where does Bitcoin currently trade?
As per data dated February 8, 2026,BTC trades close to $70٬854 USD.
What is Bitcoin’s short-term trend?
The hourly charts show signs of bullish momentum supported through rising low points suggesting potential short-lived upside moves.
Is overall trend bullish or bearish?
Despite minor rallies ,the dominant direction seen over days still reflects bearish sentiment capped around resistance zone nearing $75٬000 . & nbsp ;
What factors contribute most towards volatility today?
Heightened institutional liquidation events coupled with widespread fear-driven reactions have amplified sharp swings witnessed recently . & nbsp ;