The recent correction in Bitcoin’s price is nearing a critical threshold, just under 4% away from revisiting the $62,200 support level that could trigger further bearish movements.
Binance has reported a significant decline in its 90-day Buying Power Ratio, which has plummeted to -0.086—its lowest point in over a year. Today’s market sell-off resulted in total liquidations amounting to $620.55 million across the crypto landscape.
On Monday, Bitcoin experienced a drop exceeding 5.3%, trading around the $64,000 mark. This downturn can largely be attributed to macroeconomic uncertainties following U.S. President Donald Trump’s announcement of an increase in global tariffs from 10% to 15%. The declining value of $BTC is approaching its lower trading range limits, indicating another potential breakdown on the horizon. However, recent on-chain data reveals signs of an exhausted trend with compressed buying power that may lead to sideways movement or even an upward shift.
Extreme Decline in Bitcoin Liquidity on Binance
At Binance—the leading cryptocurrency exchange—one crucial liquidity metric has reached alarming levels: the 90-day Buying Power Ratio now stands at -0.086.
This negative figure indicates that over the past three months, more capital has exited $BTC than new stablecoin deposits have entered the platform; consequently reducing available capital for purchasing activities significantly. This reading marks one of the weakest points observed in more than a year.
A similar trend was noted between July and August of last year when this ratio hit -0.094 while Bitcoin fluctuated between $54,000 and $68,000 amid varying confidence levels among traders. Following this period saw substantial price increases culminating at approximately $102,000 by December.
The shorter timeframes illustrate recent volatility as well; around mid-February saw a sharp drop where the seven-day ratio fell dramatically to -0.90 due to concentrated selling and withdrawal pressures yet quickly rebounded from -0.164 back towards zero within days for its thirty-day counterpart.
This swift recovery during intermediate periods against persistently low figures over ninety days aligns with patterns typically observed during phases of selling exhaustion rather than fresh downward trends emerging anew.
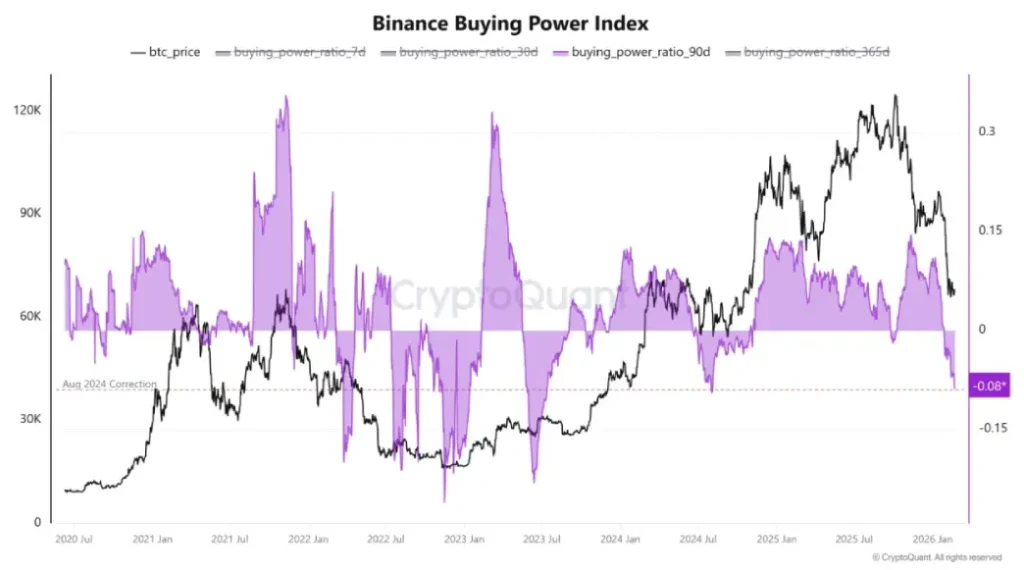
If we extend our view further outwards into longer-term metrics like those measured over three hundred sixty-five days—which still reflect slight positivity at +0.038—it suggests stability remains intact regarding stablecoin inflows relative to $BTC‘s movements within this exchange environment indicating current dips stem primarily from temporary conditions rather than any fundamental shifts affecting participant behavior or lasting capital exits overall.
Potential Downturn for Bitcoin Price if Support is Lost
The past fortnight witnessed fluctuations around $68k without clear directionality reflected through low trading volumes showcasing trader uncertainty while establishing firm ranges between both upper ($73k) & lower ($62k) boundaries respectively throughout these oscillations seen recently!
Todays’ sell-off accelerates prices toward key support zones hinting at possible breakdown scenarios ahead! The momentum indicator ADX reads high (57%) emphasizing intense selling pressure but also highlighting extended downtrends suggesting exhaustion might soon follow suit!
If buyers fail here then expect declines potentially reaching down towards cushioned areas near ~$55K followed closely thereafter by floors closer towards ~$50K respectively!
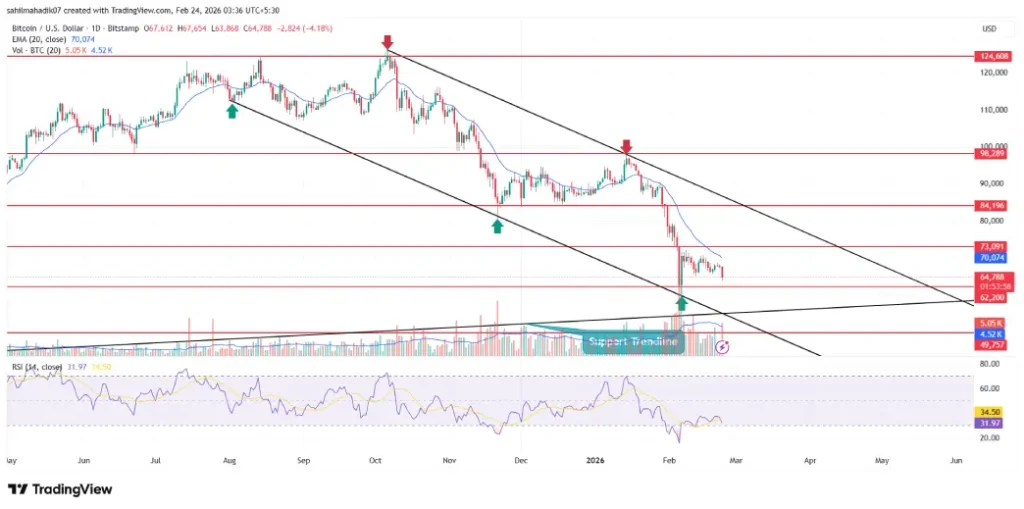
$BTC/USDT Daily Chart
An analysis based upon daily chart patterns illustrates how current bearish trends are being shaped predominantly via falling channel formations depicted above!