As of March 18, 2026, Bitcoin is in a critical consolidation phase, trading around $74,272. Following a period dominated by bearish trends that caused the cryptocurrency to pull back from its record highs in 2025, the market is now testing the strength of the resistance level at $74,000.
Bitcoin Price Insights: What’s Driving $BTC Higher?
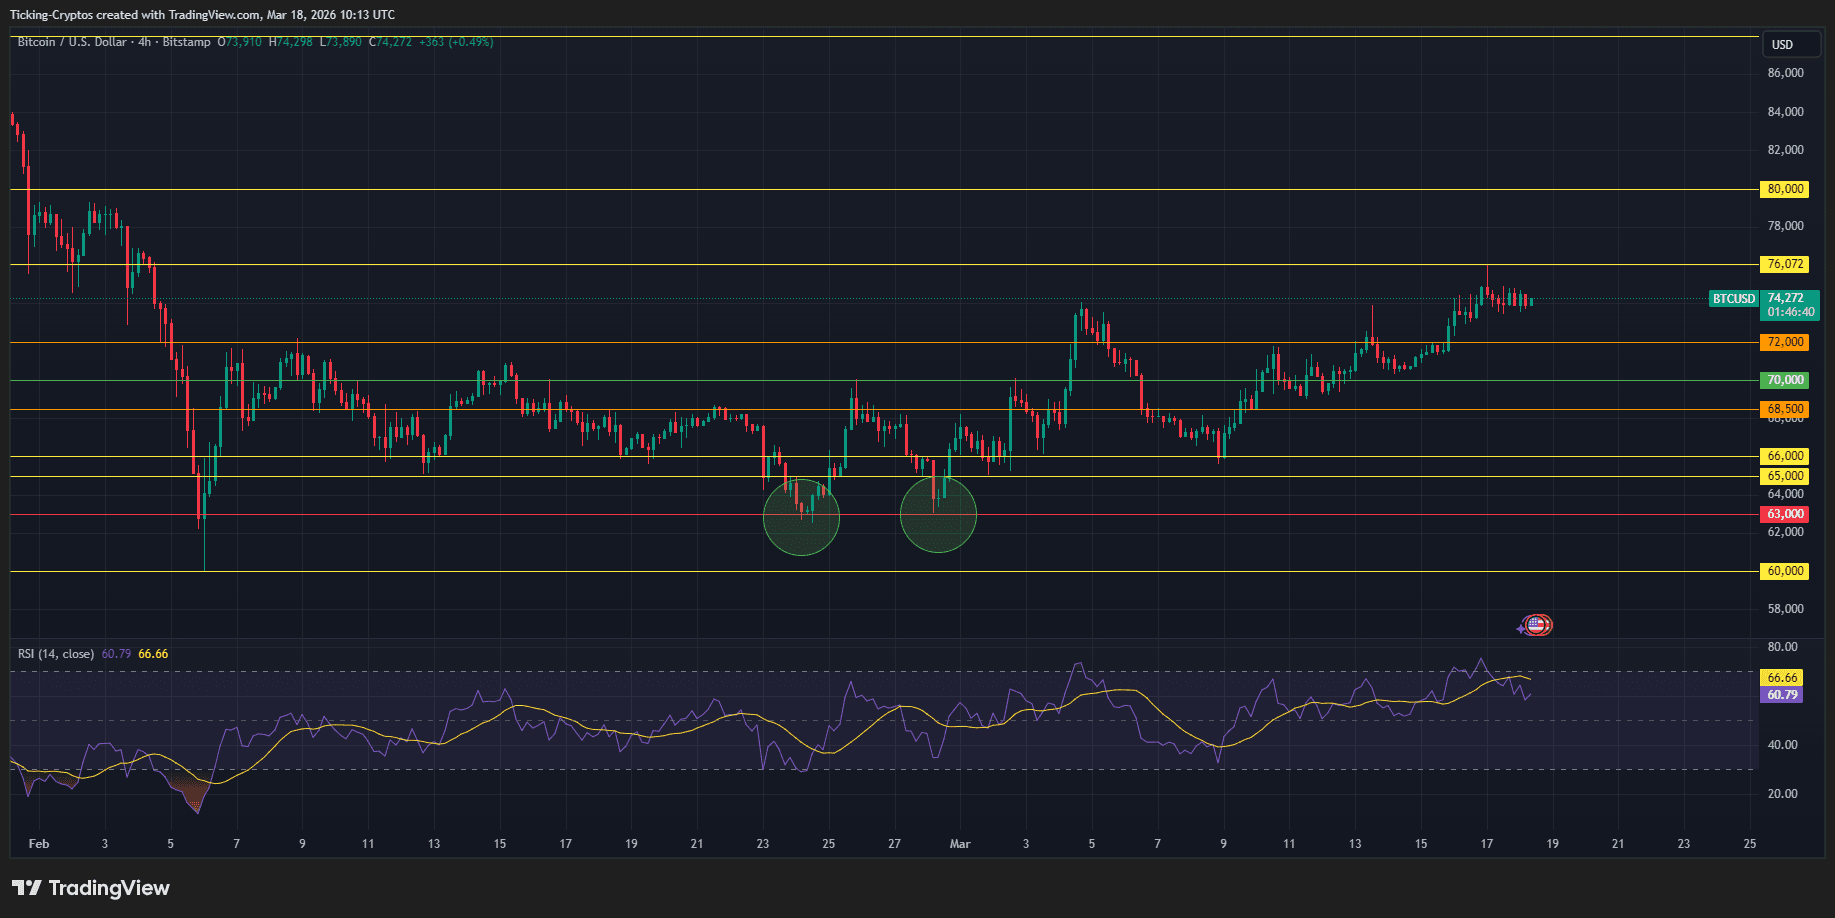
A close examination of the $BTC/USD four-hour chart reveals several significant technical indicators shaping today’s trend.
Double Bottom Recovery Pattern
The chart illustrates two notable “troughs,” indicated by green circles near the $63,000 mark. This Double Bottom pattern acted as a strong reversal signal during late February and early March, enabling Bitcoin to rise above the crucial psychological threshold of $70,000.
Resistance and Support Levels
The current price movement is constrained within well-defined horizontal boundaries:
- Immediate Resistance: Between $74,500 and $76,000. A decisive breakout above this highlighted zone is necessary to aim for the next significant challenge at $80,000.
- Critical Support: At $72,000. Should prices fail to maintain above $74,000; this green support line will serve as an initial defense point.
- Deep Support: At levels of $68,500 and then down to $65,000. These areas are essential for preventing a return to earlier bear market lows experienced this year.
An Overview on RSI and Momentum Indicators
The Relative Strength Index (RSI) currently stands at approximately 60.79. While this indicates bullish momentum exists within the market context; it has also flattened considerably as prices approach resistance levels—hinting at either a potential cooling-off phase or bearish divergence if higher price peaks occur without corresponding RSI increases.
The Current Landscape: Bitcoin News & Macro Influences
<pThe overall cryptocurrency environment reflects a "Fear" sentiment rating on the Sentiment Index (currently at 26), even with Bitcoin's recent upward movement in price.
The FOMC Influence: Traders are preparing for remarks from Federal Reserve Chair Jerome Powell. Although interest rates are likely stable for now; any hawkish comments regarding inflation—especially given oil prices exceeding$100—could incite a “sell-the-news” reaction concerning $BTC.
Catalysts from Institutional Inflows: Bloomberg reports indicate that spot Bitcoin ETFs experienced nearly$2.8 billion in net inflows throughout March—a development providing structural support for recent rally efforts.
The Gold vs. Bitcoin Discussion: With gold trading near historic highs over$5,,00 per ounce, the narrative surrounding Bitcoin’s status as “Digital Gold” faces scrutiny.
A Look Ahead: What Can We Anticipate?
This moment shows that Bitcoin demonstrates both resilience and expertise by maintaining its position around$74,,00 despite challenging macroeconomic conditions.
However,the density of information present on our four-hour chart suggests we may be nearing exhaustion within our current range.
If BTC can convert$76,,00 into support,$80,,00 appears likely achievable.
Conversely,a rejection here combined with hawkish Fed commentary could prompt rapid retesting towards$68,.50 support level..
&amp;amp;p
As of March 18,á, ... ... .... If BTC can convert &$76,,,00 into support,$80,,,00 appears likely achievable. Conversely,a rejection here combined with hawkish Fed commentary could prompt rapid retesting towards &$68,.50support level..
.