Bitcoin is currently displaying positive momentum with green candlesticks appearing on both the weekly and daily charts. This situation prompts speculation about whether the most challenging phase has already been overcome or if a prolonged downturn still lies ahead.
A compelling examination of Bitcoin’s price movements over several years challenges the rising optimism, highlighting a trend that has persisted for over ten years. This analysis suggests that time, rather than just price fluctuations, may still be an adversary in confirming a market bottom.
Historical Patterns of Bitcoin Bear Markets
Looking back to 2013, it becomes evident that Bitcoin’s bear market cycles have adhered to a consistent timeline regarding what truly matters: time itself. While each bear cycle varied in intensity, they all shared surprisingly similar durations before reaching their conclusion.
A technical chart from crypto analyst Xremin indicates that the bear market of 2024 lasted approximately 426 days before hitting its low point. The cycle from 2017 took around 363 days to complete, while the downturn following the rally in 2021 required about 376 days.
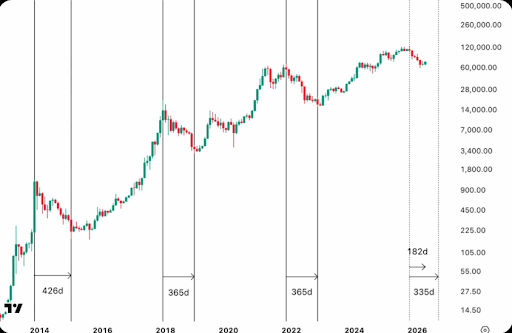
The current correction phase is only around 190 days old when measured from Bitcoin’s peak above $126,000 in October 2025. This duration represents just over half of what previous cycles experienced during their corrections.
Bitcoin has already seen a decline of roughly 43% since its all-time high. However, declaring this as the bottom at this juncture would imply breaking away from a well-established pattern spanning thirteen years without any significant structural changes to validate such an assertion.
Could We Already Be Experiencing The Bear Market?
If one were to declare this as the bottom now, it would suggest that this cycle concluded in less than half the time taken by every preceding cycle to find its lowest point. Nonetheless, there are arguments supporting an early bullish outlook; proponents could contend that both Bitcoin and its broader ecosystem possess structural dynamics absent during prior bear markets.
An illustration of these new dynamics includes US Spot Bitcoin ETFs collectively holding about 6.5% of Bitcoin’s total market capitalization—peaking at around 10% during October’s highs in 2025. Additionally, there is also movement within regulatory frameworks; for instance, March saw proposed rules by the Department of Labor aimed at providing safe harbor for retirement plan fiduciaries who include cryptocurrencies within their offerings for employees’ retirement plans like401(k)s.
These developments are significant and might mitigate future drawdowns compared to earlier cycles; however they primarily address pricing depth rather than timing issues associated with forming true bottoms.
The demand from institutional investors may help prevent prices from plummeting below $50k or even $40k but does not necessarily expedite either psychological or structural processes needed for establishing genuine cyclical lows according historical patterns which indicate reliable four-year halving cycles suggest we might not see lasting bottoms until closer towards Q4 of year twenty-sixteen (Q4-26).