
Bitcoin is currently trading around $77,500 as it navigates short-term pressures while maintaining its upward trend from April. A breakthrough above the $78,000 mark could sustain the rally, whereas a dip below $77,000 may undermine this positive momentum.
Bitcoin Maintains April Uptrend with Price Nearing $77,500
The latest data indicates that Bitcoin was trading at approximately $77,477 on a three-hour chart and remains within an ascending channel that has characterized much of its movement throughout April.
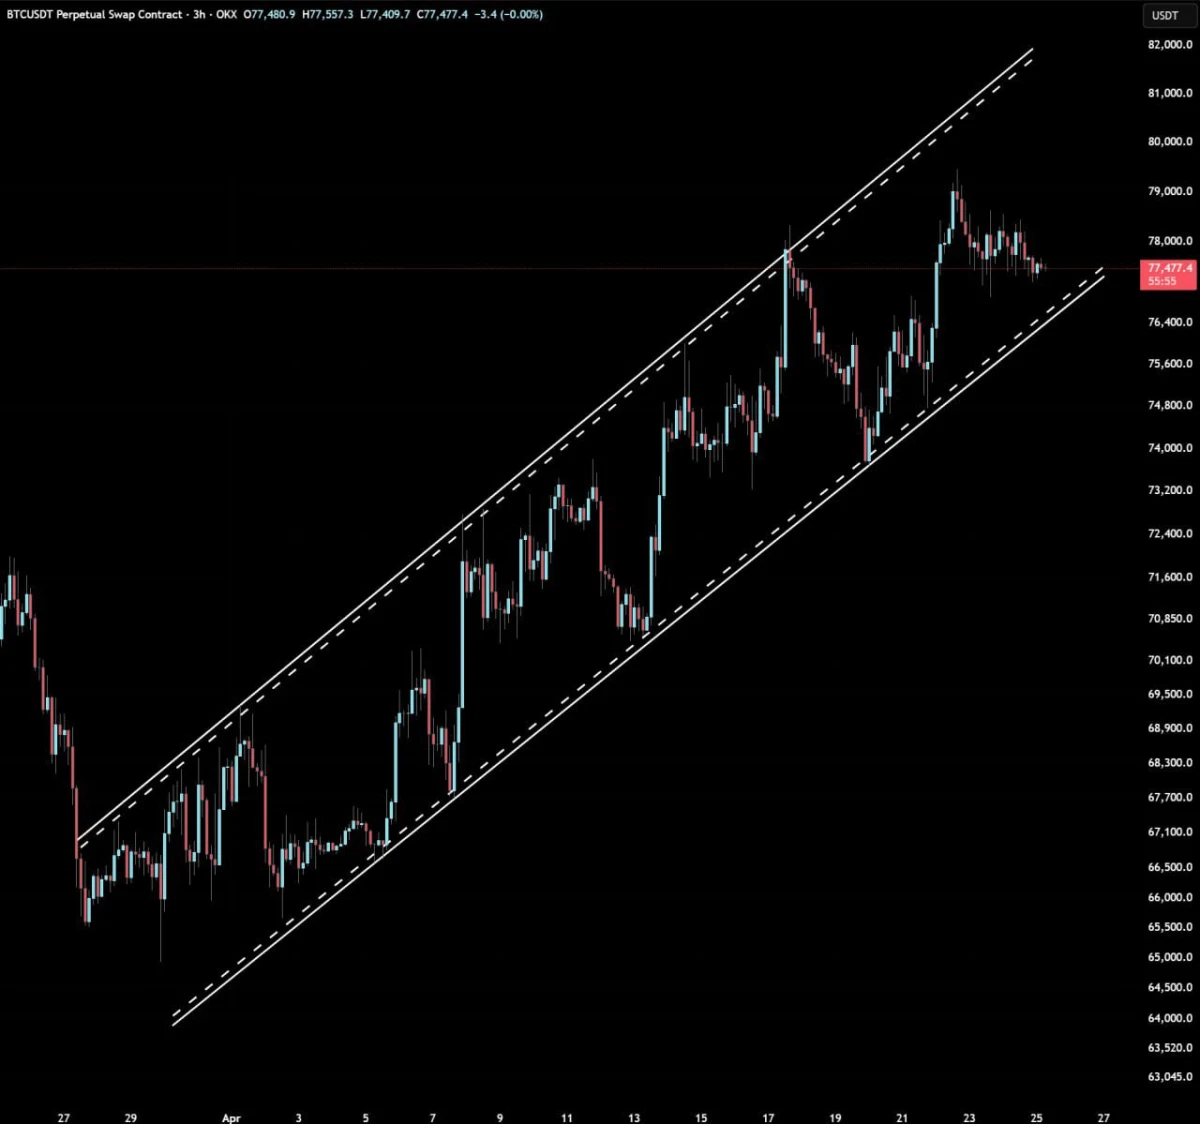
This chart reflects the BTCUSDT Perpetual Swap Contract over a three-hour timeframe. Source: Elja on X
The price of Bitcoin ($BTC) has surged from around $65,500 in late March to nearly reaching $79,000 recently. Although there has been some cooling off in prices since then, they remain within the upward channel where the lower trendline now serves as critical support.
To maintain this upward structure for April intact, Bitcoin must stay above the channel support near $76,500. A significant drop below this level would likely weaken short-term trends and redirect focus towards levels of approximately $74,800 and then down to about $73,200.
Nevertheless, as long as Bitcoin remains inside this ascending channel pattern with buyers still exerting control over broader movements for April; any rebound from support could propel BTC back toward resistance levels at around $78K and potentially revisit recent highs close to $79K.
Bitcoin Holds Steady at 77K Amid Falling Wedge Formation While Funding Rates Turn Negative
<pCurrently priced near$77 ,485 on a four-hour chart , Bitcoin is consolidating beneath a descending resistance line following its recent ascent towards$79 K .
The current price action depicts a short-term falling wedge formation characterized by lower highs converging into horizontal support situated around$ 77 K . This particular setup often indicates compression , suggesting that once prices exit this pattern , we may witness an ensuing breakout .
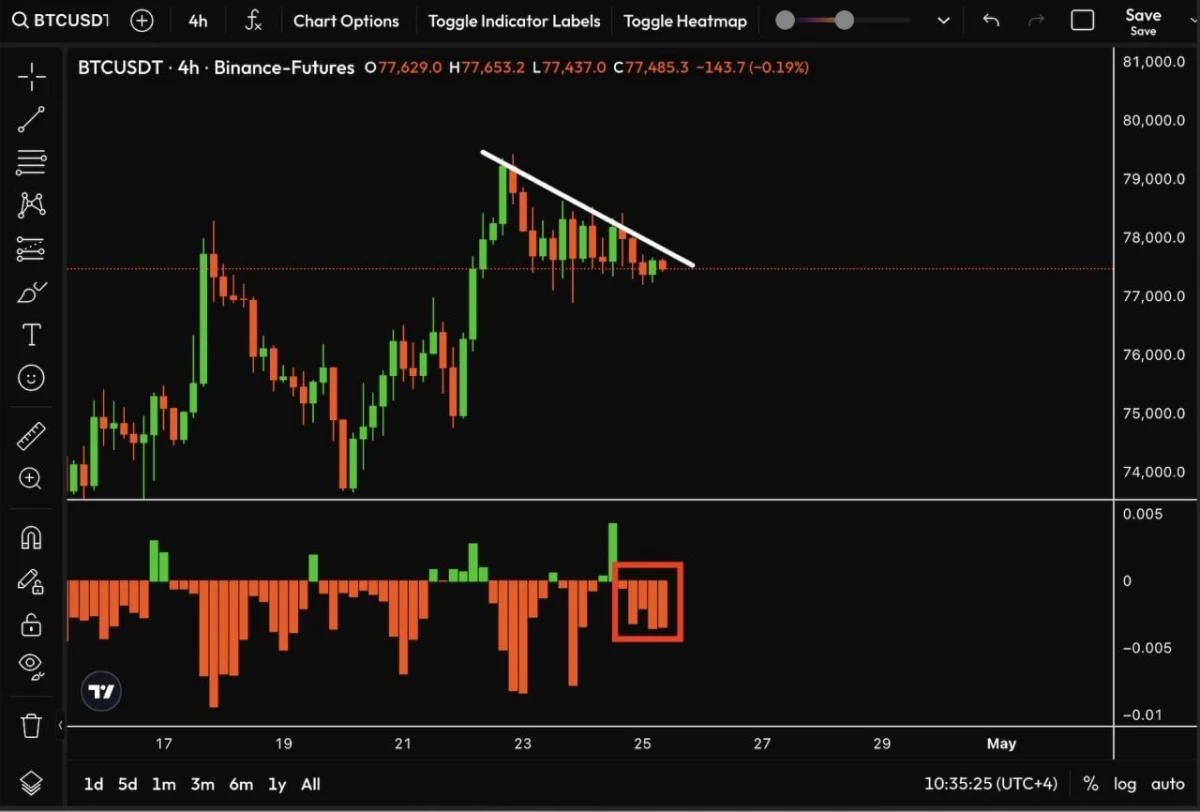
This analysis pertains to BTCUSDT over four hours timeframe. Source: Crypto Rover on X
Simultaneously observed funding rates have turned negative (as illustrated in the lower panel), indicating that more traders are taking short positions. If such positioning accumulates during consolidation phases like these,it can create conditions favorable for an upward squeeze should prices break through existing resistance levels.
At present time , key resistance rests near wedge top positioned roughly at$78 K ; if broken cleanly upwards it would pave way back towards previous high nearing$79 K . Conversely however ifBTC drops below establishedsupport levelof$ 77000 then overall structure weakens significantly leading potential revisitationof75 k next.
FAQ
- What is causing Bitcoin’s current price fluctuations?
- The fluctuations are primarily due to market pressures affecting both buyer sentiment and external factors influencing cryptocurrency valuations.
- If Bitcoin breaks below which level might we see further declines?
- A drop below approximately $76k could signal further declines toward $74k or even $73k depending on market reactions thereafter.
- What does it mean when funding rates turn negative?
- Negaive funding rates indicate more traders are betting against (shorting) bitcoin rather than buying into it; thus signaling bearish sentiment prevailing among investors currently involved in trade activity relatedto btc markets..
- What technical patterns should I watch out for ?
- Keep an eye out for formations like falling wedges or ascending channels ; these can provide insights regarding potential breakout opportunities depending upon how they resolve themselves within respective timeframes !