
Bitcoin has entered a significant resistance zone, where the sell walls from large investors and Fibonacci targets converge. Two distinct charts indicate that the market is testing the supply level near $69,000, while support at $67,467 could determine whether this upward movement continues or reverses.
Bitcoin Encounters Strong Sell Wall Near $69,000 as Whale Liquidity Tightens
The cryptocurrency is approaching a dense cluster of sell orders on the 15-minute chart. According to CoinGlass, whale liquidity between $68,800 and $69,600 will play a crucial role in deciding if Bitcoin’s current rally can extend or if it will stall.
In an update shared on X (formerly Twitter), CoinGlass highlighted that the most substantial concentration of selling pressure lies just above the $69,000 mark. The chart illustrates Bitcoin steadily climbing into this zone after recovering throughout the day; prices are nearing the lower boundary of this overhead supply area around $68,800. This scenario indicates that bullish traders are currently testing one of their most critical short-term resistance levels.
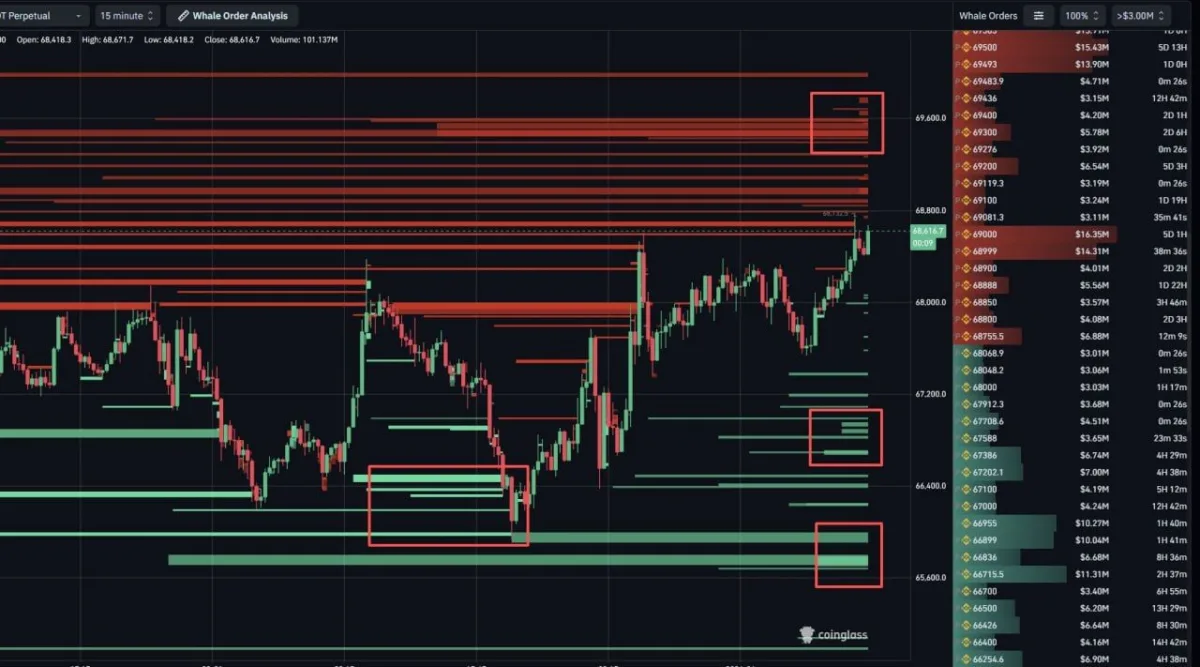
$BTC Perpetual 15-Minute Whale Order Analysis: Source: CoinGlass on X
Simultaneously, buy-side support appears to be layered beneath current market levels. The chart identifies significant bid zones near $67,200 and around $66,400; deeper support clusters are found near approximately $65,800. These areas may serve as buffers should Bitcoin fail to breach through upper liquidity levels and begins to retreat.
The overall order book structure reveals that prices are caught between stacked resistance above and multiple support levels below. As per CoinGlass’s analysis, price action is being drawn toward overhead liquidity now present in this range. If buyers manage to absorb selling pressure above the pivotal threshold of $69K effectively enough for sustained buying momentum thereafter could facilitate a quicker continuation move upwards; however if selling persists at these higher levels then we might witness another liquidity sweep leading towards rejection again.
The focus remains clear for now—Bitcoin is pushing against a major whale sell wall with its behavior around the key level of about 69K likely shaping upcoming short-term movements in price directionality.
Bitcoin Achieves 100% Fibonacci Target While Analysts Predict Further Upside Beyond Support Level
In parallel developments,Bitcoin has reached its 100% Fibonacci target according to hourly charts—a milestone noted by analyst Man of Bitcoin who described it as an ideal point corresponding with wave c within larger corrective structures observed recently .
A post shared via X indicated potential for further upside provided BTC maintains strongholds over supportive measures exceeding$67 ,467 . The BTCUSD pair was trading close towards upper limits identified within marked resistances following notable rebounds off recent lows hovering just under$64 ,974 . This technical setup reflects robust recovery patterns observed across several sessions pushing prices into regions defined by both Fibonacci retracement metrics alongside wave projections indicated earlier .
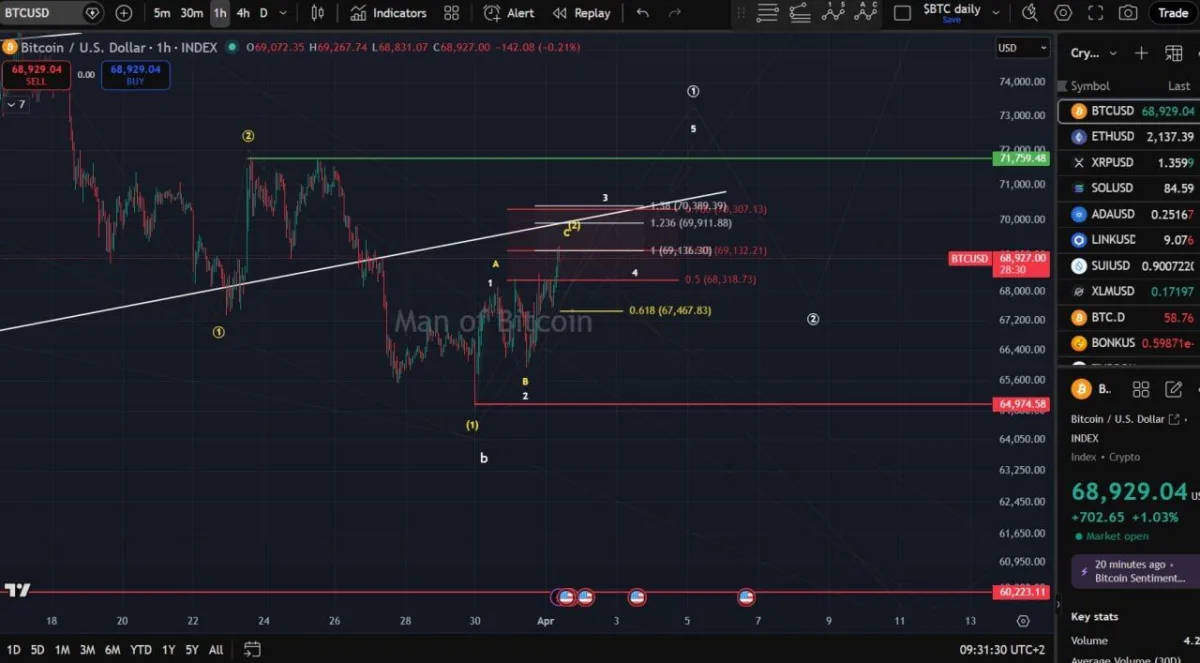
$BTC/USD Hourly Chart : Source : Man Of Bitcoin On X
Immediate resistances lie closely positioned at roughly$69 ,136 along with subsequent thresholds marked up higher reaching approximately$70 ,389 whilst broader targets extend even further up towards possible heights estimated around$71 ,759 . These identified points suggest there remains considerable room available should buyers retain control maintaining pricing dynamics favorably situated above essential supporting lines previously established earlier mentioned before.
At present time frame however it’s crucial attention turns back onto those underlying supports particularly located right next down below standing out distinctly marked closer nearby indicating first alert lines awaiting watchful eyes readying themselves prepared monitoring any shifts occurring closely tied directly backtracking whenever needed checking against previous known values such as last noted figure recorded sitting underneath being tracked down close too round number benchmarks like hitting low points seen reaching downwards touching bases eventually resting upon lower ranges expected falling closer towards figures resembling something nearer coming forth later than anticipated namely hovering somewhere inside vicinity trailing back potentially tracing back all way downward heading down possibly touching ground nearer rounding out numbers floating around somewhere close tracking along side final estimates landing neatly lining up accurately matching expectations anticipating observing fluctuations arising during ongoing trades taking place hereafter moving forward!
For now though having successfully achieved noteworthy technical objectives attained thus far future trajectories hinge largely dependent upon whether bulls succeed defending key line drawn marking off threshold set firmly held tight keeping things elevated consistently navigating past hurdles presented along pathways leading ahead beyond sight!