
On April 2, 2026, Bitcoin ($BTC) experienced a significant drop, falling below the crucial $66,000 mark. This abrupt decline has reverberated throughout the derivatives market, leading to the liquidation of long positions worth over $251.94 million within just a day.
What’s Causing Bitcoin’s Decline Today?
The ongoing downturn is driven by a combination of fundamental and technical factors creating what can be described as a “perfect storm.” Reports highlight escalating geopolitical tensions in the Middle East alongside a more aggressive U.S. trade policy due to recent tariff announcements—these developments have prompted investors to adopt a more cautious approach.
Moreover, institutional interest in spot Bitcoin ETFs has notably diminished. Recent data reveals net outflows surpassing $170 million in recent trading sessions, indicating that the robust buying momentum observed in previous months is waning. This decline in immediate demand has rendered the market susceptible to the current “long squeeze.”
Bitcoin Price Assessment: Reasons Behind Its Drop
A close examination of the 4-hour chart for $BTC/USD reveals several bearish indicators that traders should keep an eye on.
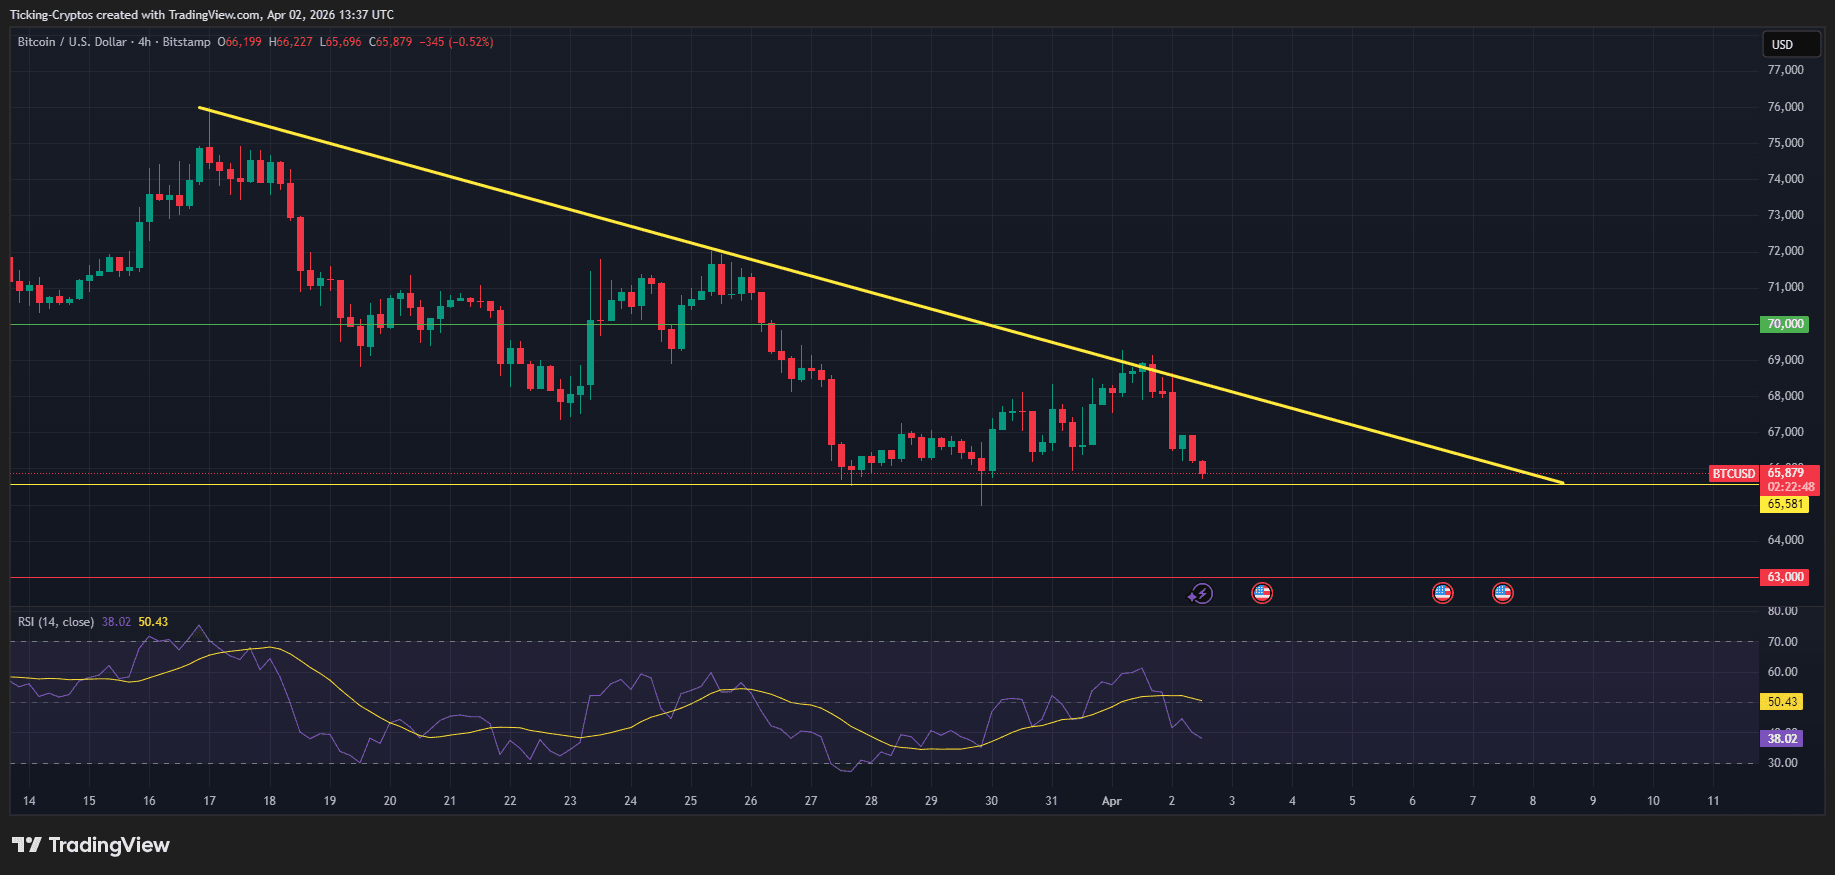
1. The Descending Resistance Trendline
A notable yellow trend line representing descending resistance has been limiting Bitcoin’s price movements since mid-March. Each attempt to breach this line has faced strong selling pressure. As of April 2nd, Bitcoin remains confined beneath this diagonal barrier situated around $67,500 – $68,000.
2. Key Support Levels
The cryptocurrency is currently testing horizontal support at approximately $65,581 on its chart.
Crucial Support: The range between $65,500 and $65,800 serves as an essential defense line for bullish traders.
Secondary Target: Should support at $65,500 fail to hold firm against selling pressure; another critical psychological and technical level lies at around $63,000.
3. RSI and Market Momentum
The Relative Strength Index (RSI) stands near 38.02 right now; while approaching “oversold” conditions (typically below 30), there remains potential for further declines before any significant rebound occurs becomes likely again soon enough—the short-term momentum clearly favors sellers presently.
| Metric | Value (Approx.) | ||
|---|---|---|---|
| Current Price | $65, | ,879 | |
| Total Liquidations | $251. | ,94 Million (Longs) | |
| Main Resistance | $67, | ,500 | |
| Main Support | $65, | ,581 | .. . . . |