The sharp decline of Bitcoin to nearly $60,000 in February is often remembered as a defining moment of market capitulation.
However, a more nuanced perspective reveals that this downturn unfolded gradually, with different groups of sellers exiting the market at various stages.
A report published on February 10 by Checkonchain characterized this drop as a rapid capitulation event marked by heavy trading volume and significant losses sufficient to reset investor sentiment.
Interestingly, the report points out that an earlier capitulation had already occurred in November 2025, involving distinct seller profiles during each phase.
To truly grasp where vulnerabilities existed during these sell-offs, it’s essential to look beyond the dramatic price movements and analyze who sold their holdings and what compelled them to do so.
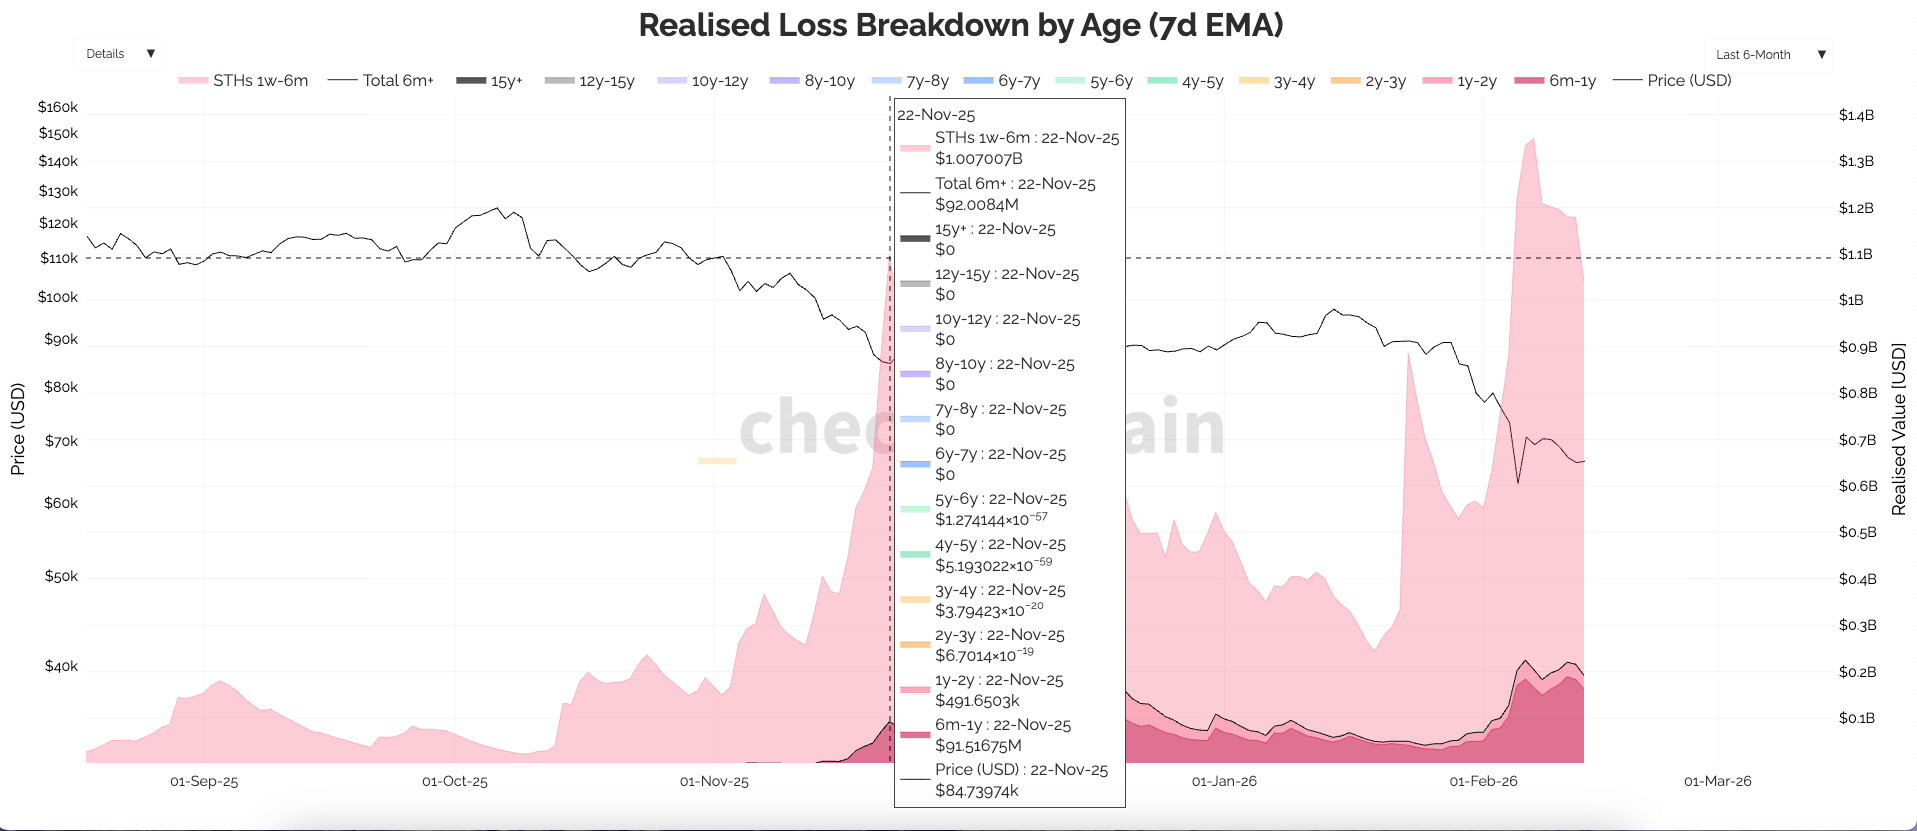
Capitulation essentially means surrender—panic selling that accelerates price declines because investors can no longer endure further losses. In cryptocurrency markets, such surrender leaves clear traces on-chain through realized losses.
The data indicates that February’s sell-off forced unprecedented loss-taking across holders. This followed an initial purge months prior.
The figures are stark: short-term holders suffered approximately $1.14 billion in losses within one day while long-term holders incurred around $225 million on the same day.
When netting realized profits against these losses, the overall net realized loss hovered near $1.5 billion daily during peak periods. Viewing November 2025 and February 2026 as separate capitulations reveals each event saw over $2 billion per day in realized losses independently.
This dual-event framework helps explain why prices sometimes appear stable only to collapse again—the risk-bearing group shifts over time.
A particular cohort might weather one downturn but fail under renewed pressure or disappointment when they realize their initial dip purchase was just one among many dips ahead.
Phase One: November Breaks the Class of 2025
The first major capitulation took place in November 2025 when Bitcoin dropped near $80,000 levels.
This event predominantly affected what analysts call the “class of 2025,” referring to coins acquired during that year whose owners bore about 95% of realized losses then recorded.
This cohort concept groups coins based on acquisition dates; tracking last on-chain movement timestamps provides cost basis data for individual units which aggregated network-wide reveal who holds underwater positions versus profitable ones—a foundation for calculating metrics like realized price (the average cost basis).
Sellers at this stage were those frustrated after enduring a year without clear market direction or resolution—what could be described as exhaustion-driven capitulation rather than panic triggered solely by falling prices alone. They chose being flat over remaining stuck holding losing positions indefinitely—a shift from time-based pain into tangible financial pain causing them to exit positions prematurely yet understandably so given prolonged sideways action throughout much of 2025’s macro environment:
Phase Two: February Shatters Dip Buyers Alongside Remaining Holders
The second wave arrived with very different dynamics around mid-February when Bitcoin hit lows near $60,000 again but now involved both “class of ’25” sellers alongside newer buyers from early ’26—the latter having purchased between roughly $80K-$98K expecting bottom formation but instead facing fresh declines eroding confidence deeply enough for forced exits too —a classic broken-confidence scenario underpinning true capitulation here:
- Younger buyers regretted premature entry thinking they caught bottoms;
- Elder cohort members sold due partly due regret missing earlier exit opportunities;
———
———
– This pattern reflects realistic investor behavior where selling is not triggered simply by unrealized loss but also by missed chances coupled with subsequent worsening conditions.
–
–
–
–
The combination explains why total daily net realized loss surged dramatically reaching historical peaks exceeding approximately US$1.5 billion per day amid muted profit-taking contrasting explosive forced sales activity.
An Unprecedented Volume Surge Accompanies Capitulations
Volume across spot markets along with ETFs,futures,and options soared sharply coinciding precisely with these events.nnnnnnnnnAggregate spot volumes averaged about US$15.4 billion daily while ETF weekly turnover reached record highs nearing US$45.6 billion.nFutures trading doubled from roughly US$62 billion up past US$107 billion per day.nOptions volume similarly jumped twofold since January hitting nearly US$12 billion daily driven largely (~50%)by IBIT contracts surpassing Deribit volumes (~US$4B/day).nSuch elevated activity underscores how mass liquidation phases require active counterparty participation reflecting intense debates about value between desperate sellers & committed buyers simultaneously across all venues.”
Basing Bottoms On Bands Rather Than Single Points Makes More Sense
The temptation exists after seeing dramatic wicks like those seen recently,to declare exact bottoms using single-price points such as '$60k bottom? Yes or No?'nbut analysis suggests better understanding comes from viewing bottoms dynamically—as ranges shaped around average cost bases rather than isolated moments marked solely by candle shadows.u003Csupu003Eu003C/supu003Eu003C/iu003Eu003C/supu003Eu003C/supu003Eu200B
Two key reference levels anchor this band:
- The 'realized price', estimated near $55k representing network-wide average acquisition costs derived via last-on-chain transaction prices;
- A broader ‘market mean’ approximated currently at ~$79{,}400 reflecting typical trade values adjusted upwards above base costs.</ul</sub</sub</sub</sub</sub</sub<.Bottom formations typically unfold below mean values yet remain above average acquisition costs indicating gradual recovery phases post-selloffs.
Spending sustained periods beneath realised pricing challenges bullish narratives thus forming practical bands helping traders gauge healthier floors.
Moreover,the recent low touched close proximity towards widely-followed technical support zones including bitcoin's notable long-term moving averages (such as its critical
200-week moving average), historically respected throughout bear cycles enhancing confidence intervals surrounding current valuations.Combining cohort-specific rotation insights clarifies how february's flush represented not an arbitrary threshold breach,but convergence point where compelled liquidations finally met willing counterparties absorbing supply enabling eventual stabilization processes underway.
Mistakes Made By Those Relying Solely On Calendar Cycles Explained
Post-capitulations,it’s common practice among observers eager for neat conclusions relying heavily upon calendar milestones like four-year cycles,twelve-month lows,and anniversaries offering tidy narratives.
Yet,this approach proves misleading here since bear-market distress unfolded unevenly split into distinct phases blending prolonged stagnation draining conviction followed abruptly by violent corrections forcing multiple cohorts out simultaneously undermining simplistic timing heuristics favoring uniform delivery modes.
Understanding who sells matters far more than merely when it happens because different participant classes respond uniquely depending upon accumulated psychological fatigue combined with shifting risk tolerance thresholds:
- The first act cleared participants fatigued after enduring extended sideways trends devoid meaningful gains;
- The second purged newly emboldened dip-buyers discovering premature optimism shattered under renewed volatility stressors;
- Together these waves removed substantial marginal supply softening future downside risks potentially paving way toward measured recoveries grounded firmly upon earned confidence rebuilding rather than wishful thinking alone.
In sum,two discrete rounds of widespread liquidations provide valuable maps highlighting vulnerable hands already exited alongside cohorts still navigating recovery paths emphasizing gradual digestion ahead featuring cooling pressure reflected through reduced realised-loss rates,broadening stability between key cost-basis markers,and incremental restoration efforts fostering sustainable appetite for risk aligned closely with fundamental progressions instead superficial rebounds fueled purely via sentiment swings.
Rather than chasing folklore fixated exclusively upon singular candle extremes,the comprehensive seller landscape offers deeper lasting insight illuminating underlying structural shifts shaping bitcoin’s evolving trajectory amidst ongoing volatility cycles.