Geopolitical Turbulence Affects Bitcoin
The cryptocurrency market faced a sudden surge of volatility today following a stern warning from U.S. President Donald Trump regarding escalating tensions with Iran.
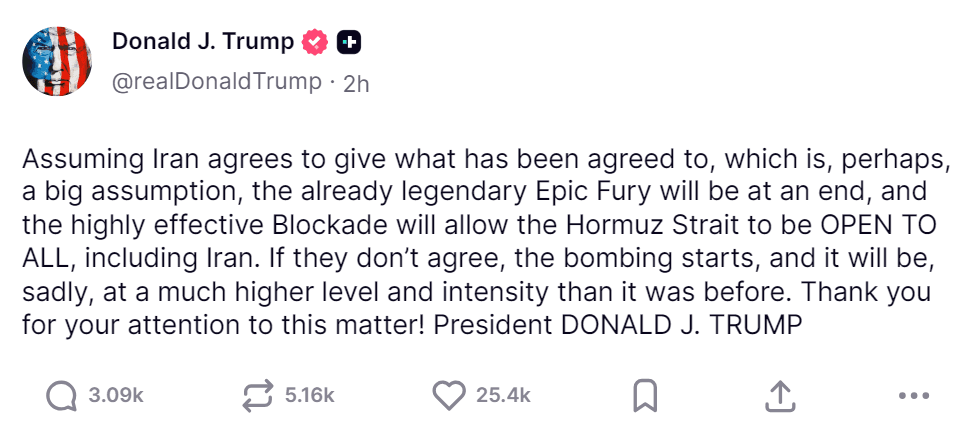
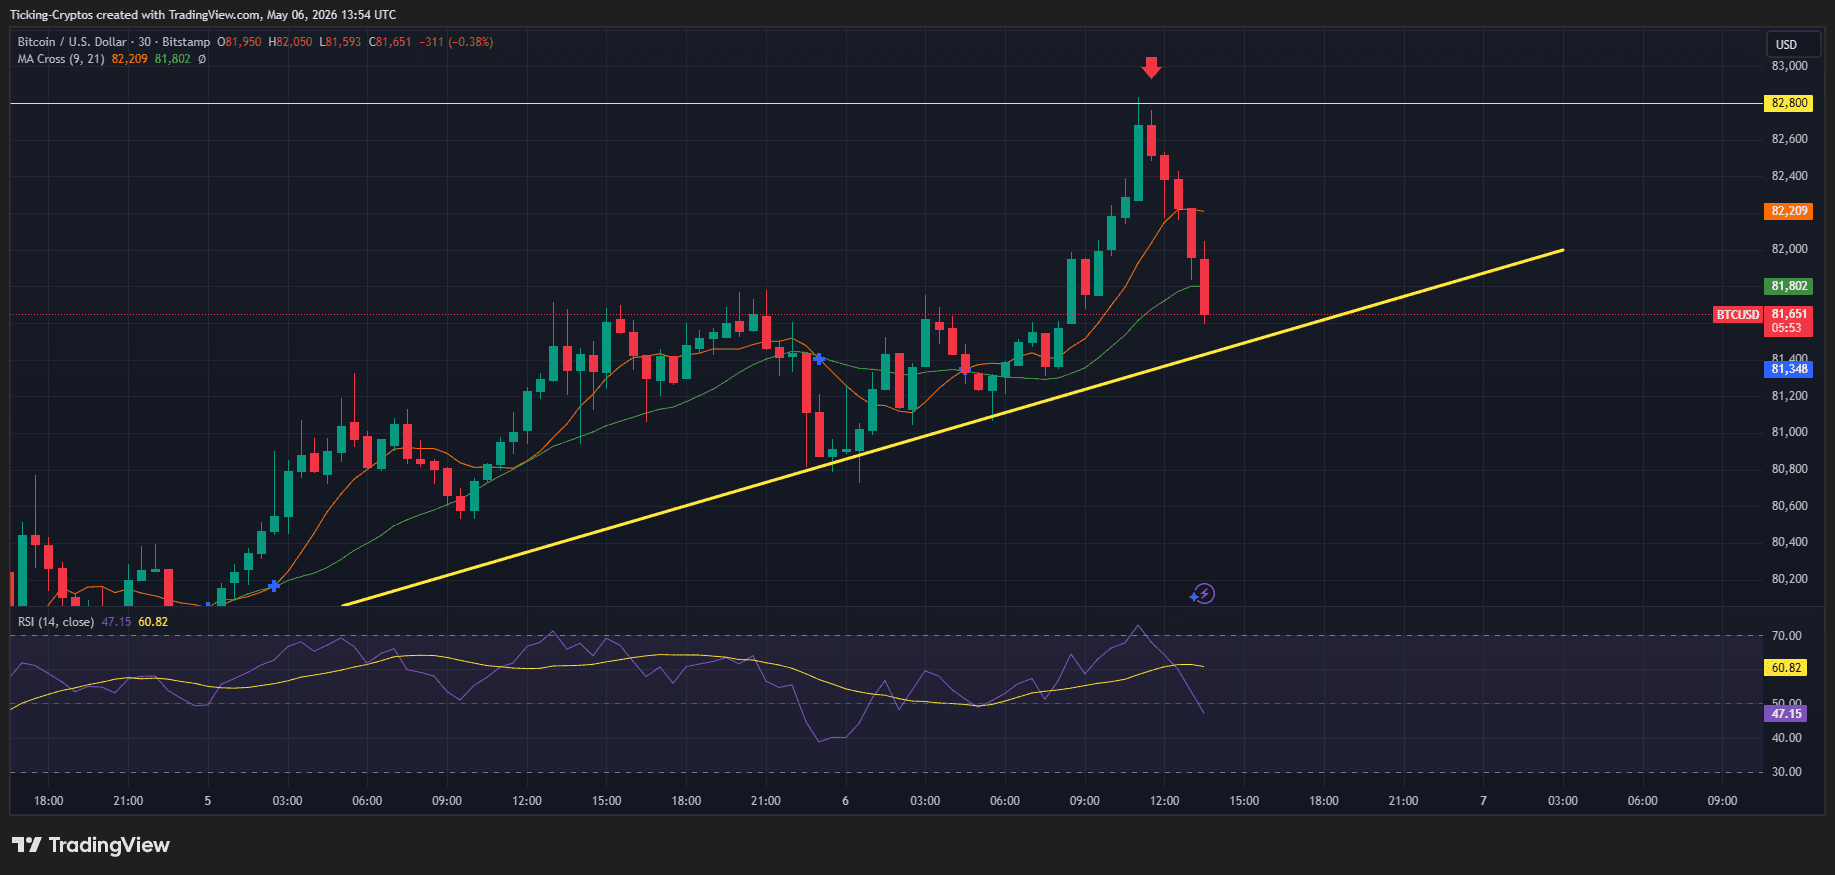
The immediate effect on Bitcoin ($BTC) was significant. The leading digital currency, which had recently peaked at $82,800, plummeted to $81,600 just minutes after the announcement. This sharp decline erased gains made over the past 24 hours and left traders pondering whether this signals an end to the bullish trend or if it is merely “noise” within a broader upward movement.
What Caused the Crypto Decline?
Despite being often referred to as “digital gold,” Bitcoin’s short-term price fluctuations are highly susceptible to macro-geopolitical uncertainties. The potential for renewed military conflict typically triggers a “risk-off” mentality among traders, prompting them to exit speculative positions in favor of cash or traditional safe havens.
Nevertheless, the current dip of approximately 1.5% is relatively minor when juxtaposed with Bitcoin’s remarkable growth throughout early 2026. Data from major exchanges indicates that while liquidations surged, buy orders around the $81,000 mark remain strong.
Bitcoin Price Evaluation: A Typical Adjustment?
An analysis of the 30-minute $BTC/USD chart suggests that this recent drop resembles more of a standard technical pullback rather than an outright crash.
1. The Ascending Support Line
Bitcoin has been adhering to a clearly defined yellow trendline (ascending support) for several days now. Even after dipping down to $81,651, it remains well above this trendline. As long as $BTC stays above $81,300, its uptrend structure remains technically sound.
2. Moving Average Cross Analysis
The Moving Average (MA) Cross (9 and 21 periods) indicates that prices are currently testing short-term averages; it’s common for brief dips below these averages during periods influenced by news events like this one. The “red arrow” on our chart highlights the peak at $82,800—now acting as immediate resistance that needs overcoming.
3. RSI Normalization Process
The Relative Strength Index (RSI) had reached overbought levels (near 70) during its ascent towards $82k+. However,”Trump Dip” has effectively cooled off RSI down to neutral territory at 47.15—a healthy reset allowing room for potential moves toward higher targets like $85k in future sessions.
The Road Ahead: What’s Next?
This week’s price movements will likely be heavily influenced by geopolitical developments surrounding U.S.-Iran relations; should diplomatic negotiations show promise of progress soon enough—there could be swift recovery back towards previous highs near$82k+. Conversely though if tensions escalate into actual conflict scenarios—we might see tests around key psychological support levels such as$80K instead!
FAQ:
A1: The drop was triggered by geopolitical tensions between the U.S and Iran following President Trump’s warning.
A2: No! This decline is minor relative to Bitcoin’s substantial growth earlier in early 2026.
A3 : Current indicators suggest it may just be normal adjustments rather than catastrophic crashes , given ascending support lines & moving average tests .
A4 : Geopolitical developments can lead either rapid recoveries or declines depending on how situations unfold between involved nations .