As Bitcoin (BTC) aims to reclaim the $100,000 threshold, a seasoned trading analyst has cautioned that the cryptocurrency might undergo additional corrections later this year, with a potential drop down to $60,000.
On January 16, TradingShot shared an insightful analysis on TradingView, which utilized a comprehensive long-term cycle model. This model integrates halving schedules, moving averages, and Fibonacci time extensions to forecast Bitcoin’s trajectory.
The study highlights that Bitcoin is nearing a crucial technical hurdle at its daily 200-day moving average (MA). Historically, this level has often triggered the second phase of bearish cycles. Previous trends suggest that encountering resistance here typically results in prolonged downward pressure rather than brief pullbacks—indicating a transition from distribution into deeper retracement phases.
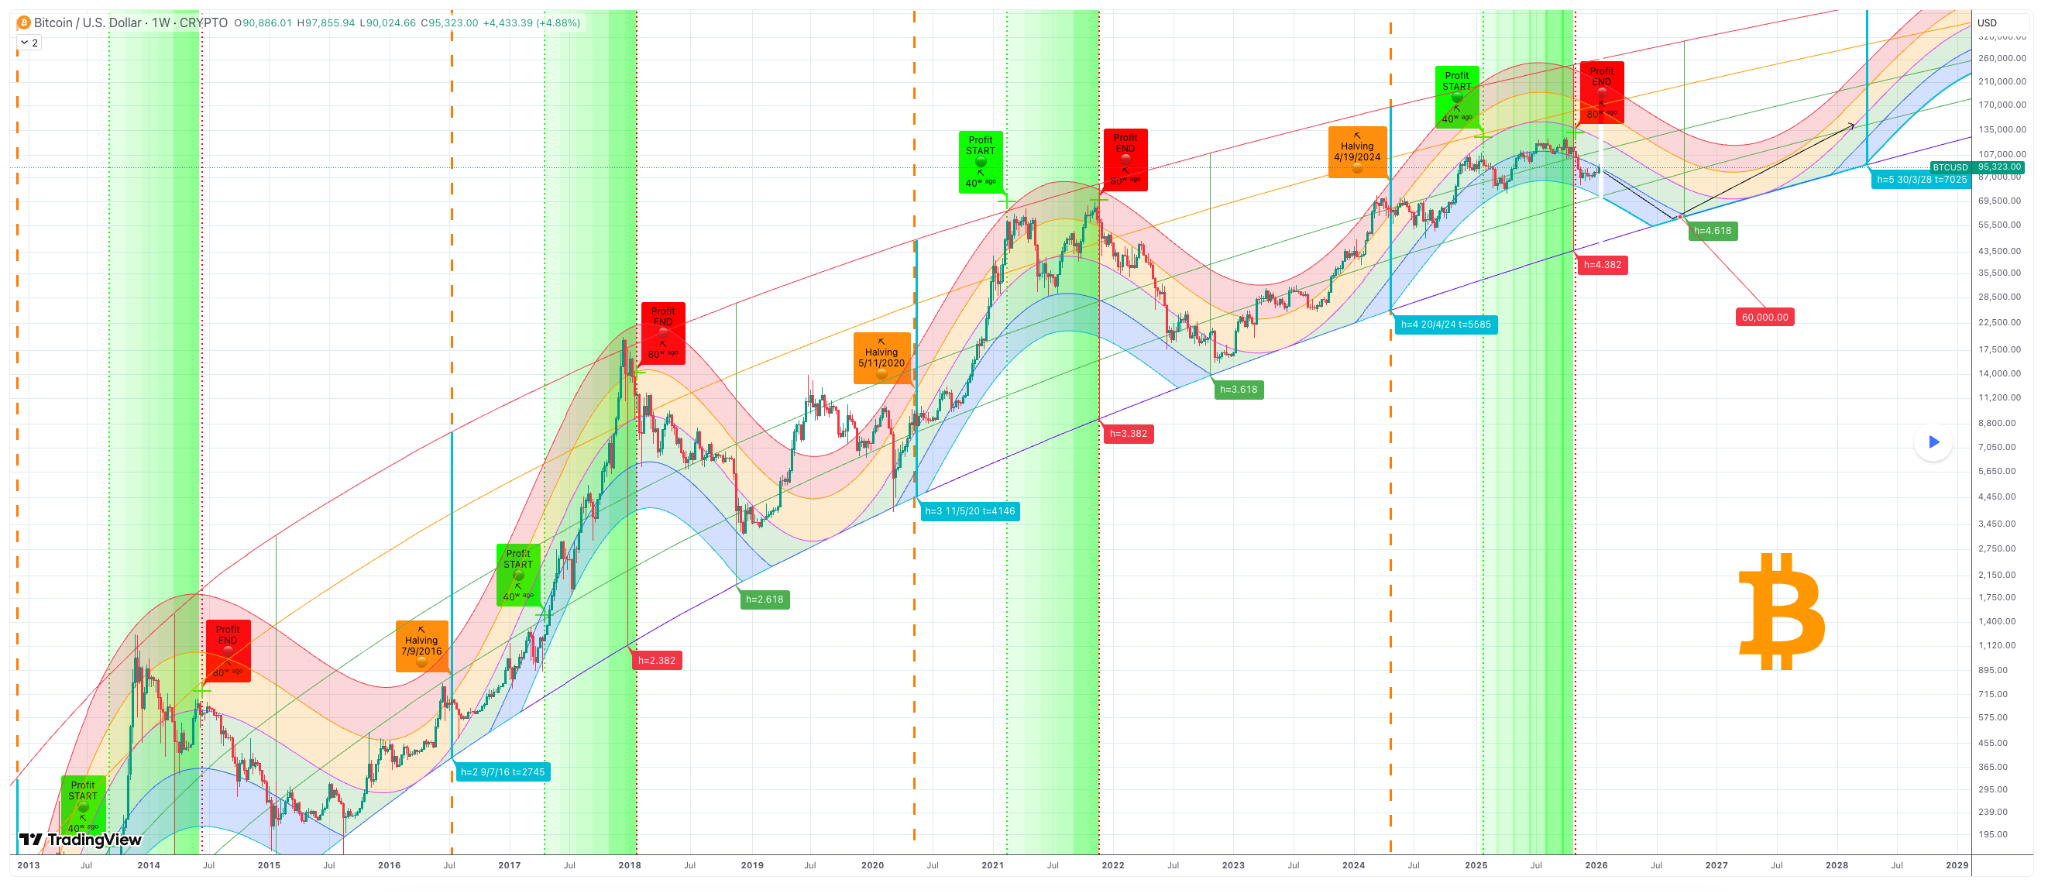
The rainbow cycle chart further supports this outlook by correlating price movements with halving events and Fibonacci time extensions. The next significant target is identified at the 4.618 Fibonacci extension during the last week of September 2026—a period historically associated with market cycle lows. At this juncture, Bitcoin is projected to trade near $60,000—a notable decline from peak levels but still aligned with its overarching upward trend.
This forecasted bottom notably precedes the upcoming halving event expected around April 2028. Consequently, it suggests that market participants would be distant from entering another profit-taking phase at that time.
Bitcoin’s Missed Opportunity Above $150K
The inability of Bitcoin to surpass the upper orange band on the rainbow chart—representing over $150,000 during its latest bull run—reinforces concerns about diminishing returns in each successive cycle as percentage gains shrink over time.
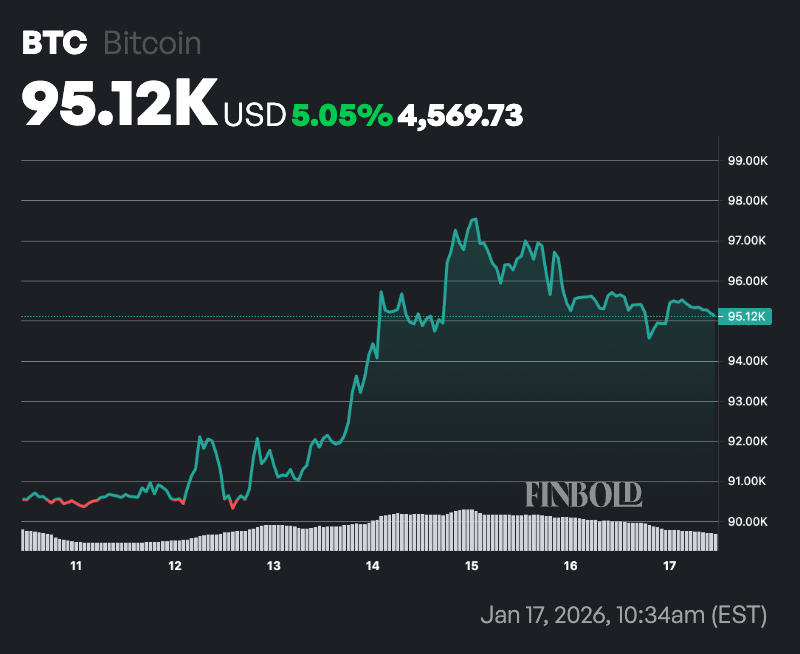
This bearish sentiment emerges amid recent attempts by Bitcoin to breach the $100K mark before pulling back slightly. Earlier in the week, optimism surged following institutional inflows after breaking out from extended consolidation near $90K and rallying close to $98K.
This movement sparked hopes that traders betting on sideways or declining prices would need to exit their positions forcefully enough to push BTC beyond $100K once again.
However, momentum quickly dissipated instead of sustaining upward momentum. Rather than continuing higher rallies like anticipated earlier in January 2024, Bitcoin reversed direction and now exhibits signs of weakening strength—raising chances for retracement toward low-$90K territory.
An Overview Of Current Price Dynamics
At press time, Bitcoin was valued around $95,123, a slight dip of approximately -0.4% over twenty-four hours.
From moving average indicators perspective, the short-term bullish signal remains intact as BTC trades above its fifty-day simple moving average (SMA) positioned near $90,095.
Conversely, the two-hundred-day SMA located around $105,657 acts as resistance indicating longer-term bearish pressures or ongoing correction phases following previous highs.
Meanwhile, the fourteen-day relative strength index (RSI) stands neutral at approximately sixty-three point three zero indicating no immediate overbought conditions while leaving room for potential upside moves without triggering abrupt reversals although monitoring shifts remains essential.