
Bearish investors are showing increased interest in the market, which could indicate a potential breakout for Bitcoin ($BTC) at a time when the leading cryptocurrency is facing pressure from a wider market downturn.
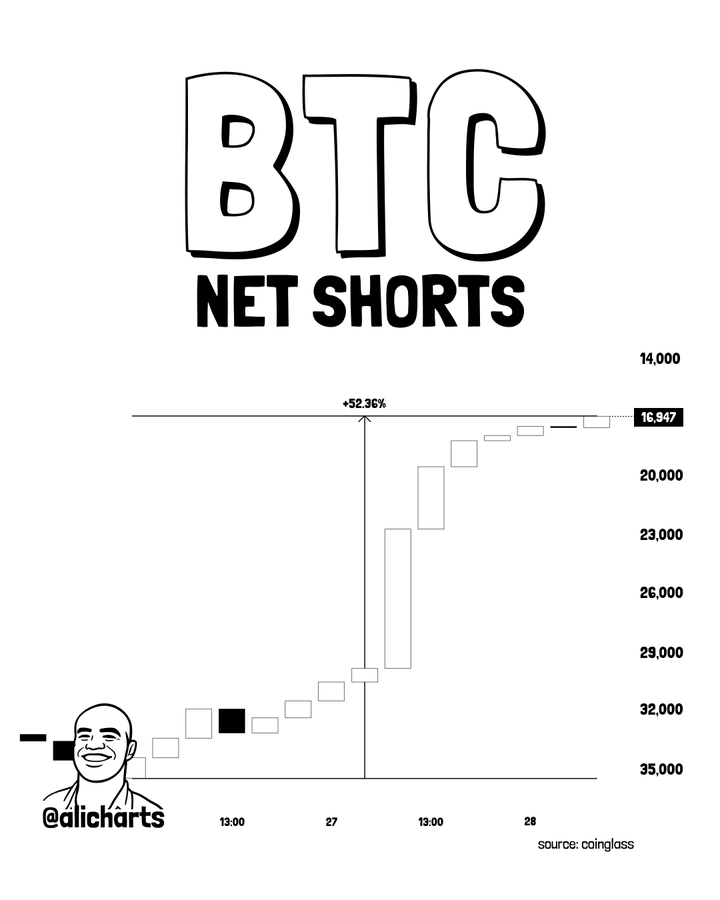
Recent data reveals that net short positions on Bitcoin surged by over 52% within just two days, representing one of the most significant accumulations of bearish bets seen in recent months. This information was shared by Ali Martinez on March 28.
The trend indicates a rapid and sustained increase in net shorts, with positioning accelerating sharply around March 27 and continuing into subsequent sessions. This swift rise implies that an increasing number of traders anticipate further declines in price.
Nevertheless, such crowded positions can often lead to unexpected outcomes. When too many traders bet heavily against an asset, it creates vulnerability for the market to reverse direction—especially if price movements begin to contradict prevailing expectations.
This scenario suggests that heightened short exposure raises the chances of triggering a short squeeze event.
If Bitcoin starts to rally, those holding short positions may need to close them out to mitigate losses—this would involve repurchasing the asset and consequently exerting upward pressure on its price.
The unwinding of these positions could lead to a chain reaction of forced buying that accelerates gains and heightens volatility.
This situation illustrates how sentiment has turned increasingly negative while prices have not decisively broken lower—a setup often preceding significant movement in either direction.
While this accumulation of shorts does not guarantee an upward trend, it indicates that we are at a critical juncture where discrepancies between trader positioning and actual price movements might pave the way for future breakouts depending on upcoming actions taken by traders.
Bitcoin Signals Potential Further Decline
This outlook emerges as Bitcoin’s value dipped below $70,000 with technical indicators suggesting more potential declines ahead.
An analysis conducted by charting platform TrendSpider, released on March 27th, pointed out notable similarities between Bitcoin’s current consolidation phase and previous formations resembling rising channels which ultimately broke downward. In past instances like this one,$BTC‘s value fell over 34% within approximately two weeks after breaching channel support levels.
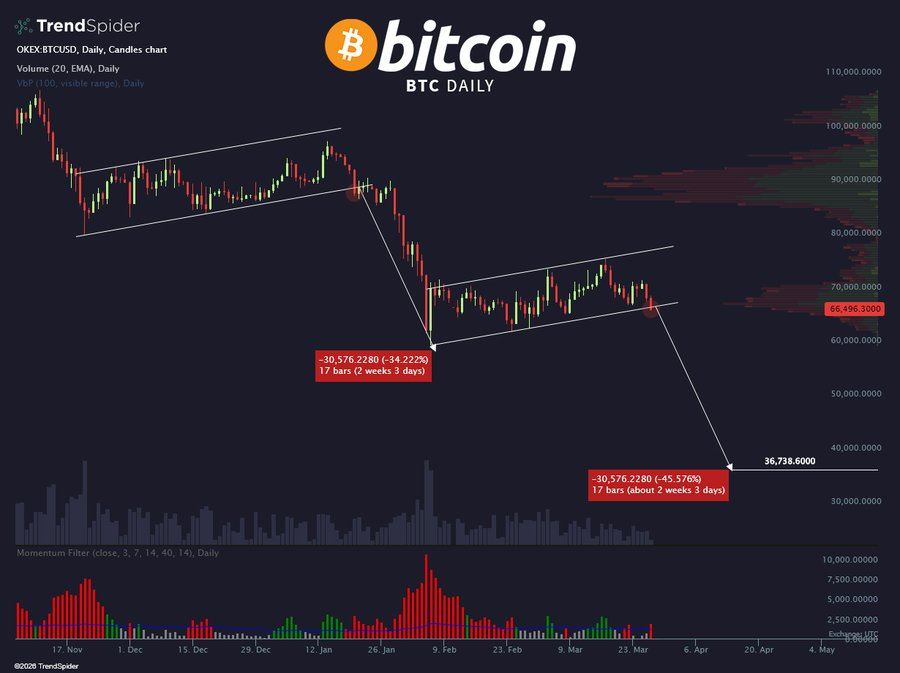
The current pattern mirrors this behavior as prices have slipped beneath a temporary ascending channel near $66,000; should history repeat itself here again we might see accelerated drops towards mid-$30k ranges ahead!
Additonally volume profile data reveals relatively weak support levels beneath present pricing—which could exacerbate volatility if selling pressures escalate significantly moving forward!
An Overview Of Current Price Movements For BTC
Around press time BTC was trading at around $66k805—a modest increase (about +1%) recorded during last twenty-four hours—but still down more than five percent across broader periods tracked recently!

Pursuing our examination , presently btc seems entrenched within cautious consolidation phases ; breaking above resistance zones marked @70 k &72 k may indicate renewed bullish momentum whilst decisive breaches below65 k would likely usher forth additional downside pressures !