The price of Bitcoin continues to hover around $68,000 as it attempts to recover from its waning bearish momentum.
On the daily chart, a descending channel pattern is shaping a consistent mid-term trend for $BTC.
Recent readings of Long-Term Holder Net Unrealized Profit/Loss (LTH-NUPL) between 0.39 and 0.41 indicate that long-term holders are still enjoying overall profits.
On Monday, Bitcoin’s value dipped by 1.14%, trading at $67,981. This decline may be attributed to investor reactions regarding delays in the regulation surrounding the CLARITY Act and persistent overhead supply near the $70,000 mark. Although $BTC has remained relatively stable over the past two weeks, recent on-chain data suggests that it is far from reaching its lowest point. Will this leading cryptocurrency drop below the critical support level of $60,000?
LTH-NUPL Could Indicate Upcoming Market Bottom
In recent months, Bitcoin’s price has plummeted from an all-time high of $126,272 down to its current trading level of $68,424. The market faces significant selling pressure at around $70,000; thus analysts anticipate further corrections ahead.
A key concern among Bitcoin enthusiasts revolves around identifying potential bottom levels; analysts highlight LTH-NUPL as a crucial metric for recognizing shifts in market cycles. This indicator assesses unrealized gains or losses for coins held longer than 155 days and reflects committed investors’ positions.
The latest figures place LTH-NUPL between 0.39 and 0.41—indicating that these long-term holders remain in profit territory overall. This metric aids in understanding how far current prices deviate from this group’s average acquisition cost.
Historical trends have shown that transitions into negative values—where unrealized losses become prominent among long-term participants—often precede significant reversals in market direction. In prior cycles, such downturns coincided with widespread capitulation phases characterized by reduced selling pressure followed by accumulation periods which propelled subsequent uptrends.
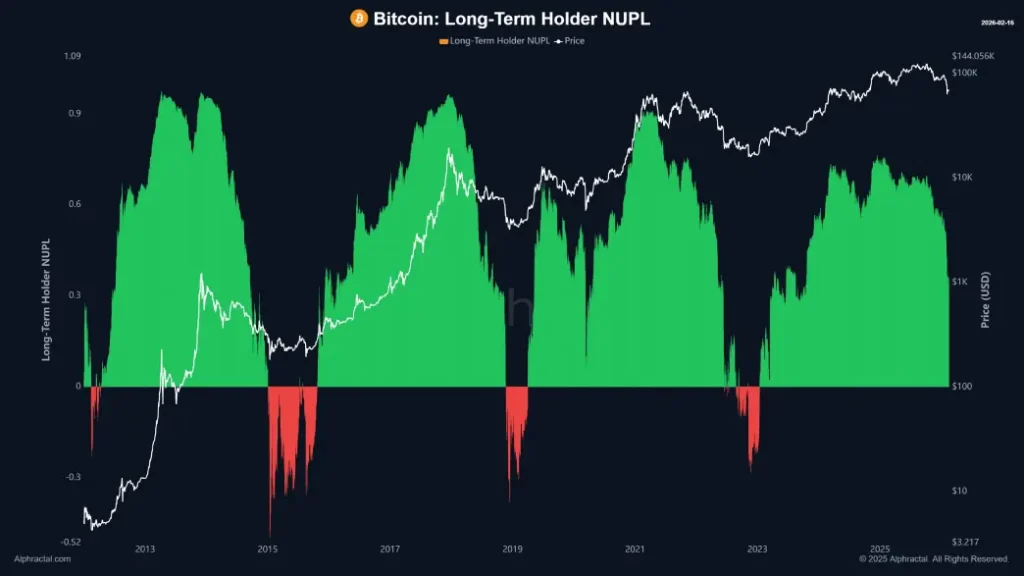
An analysis of accompanying charts indicates that if $BTC falls below $41,000 , we could see LTH-NUPL dip into negative territory—a substantial shift away from recent trading ranges potentially signaling exhaustion among weaker hands.
If Next Breakdown Occurs: Bitcoin Price Fluctuates Within Narrow Range
The past fortnight has seen Bitcoin’s price oscillating near the $68K threshold—a consolidation marked by short-bodied candles with pronounced wicks on both ends—which suggests indecision among buyers and sellers regarding sustained price movement directionality.
This lateral trend appears confined within February 5th’s candle range—with highs at approximately $73K and lows nearing $62K—offering sellers a temporary respite to regain their bearish momentum before any decisive moves occur.
If selling pressure continues unabatedly towards breaking through support at approximately $$62K$, there exists potential for further declines; post-breakdown scenarios could see prices retracing another 11% towards testing critical support levels near $$55K$ .
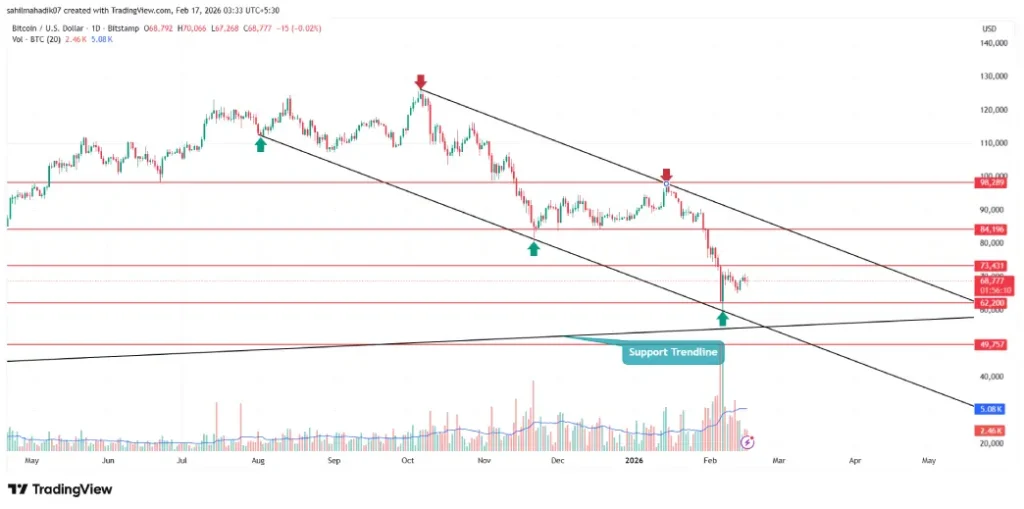
$BTC/USDT -1d Chart
Since December last year,this trendline has served as an essential accumulation zone where buyers can rejuvenate recovery efforts.A bullish reversal or downside breakdown here could significantly impact future pricing trajectories for $ BTC .