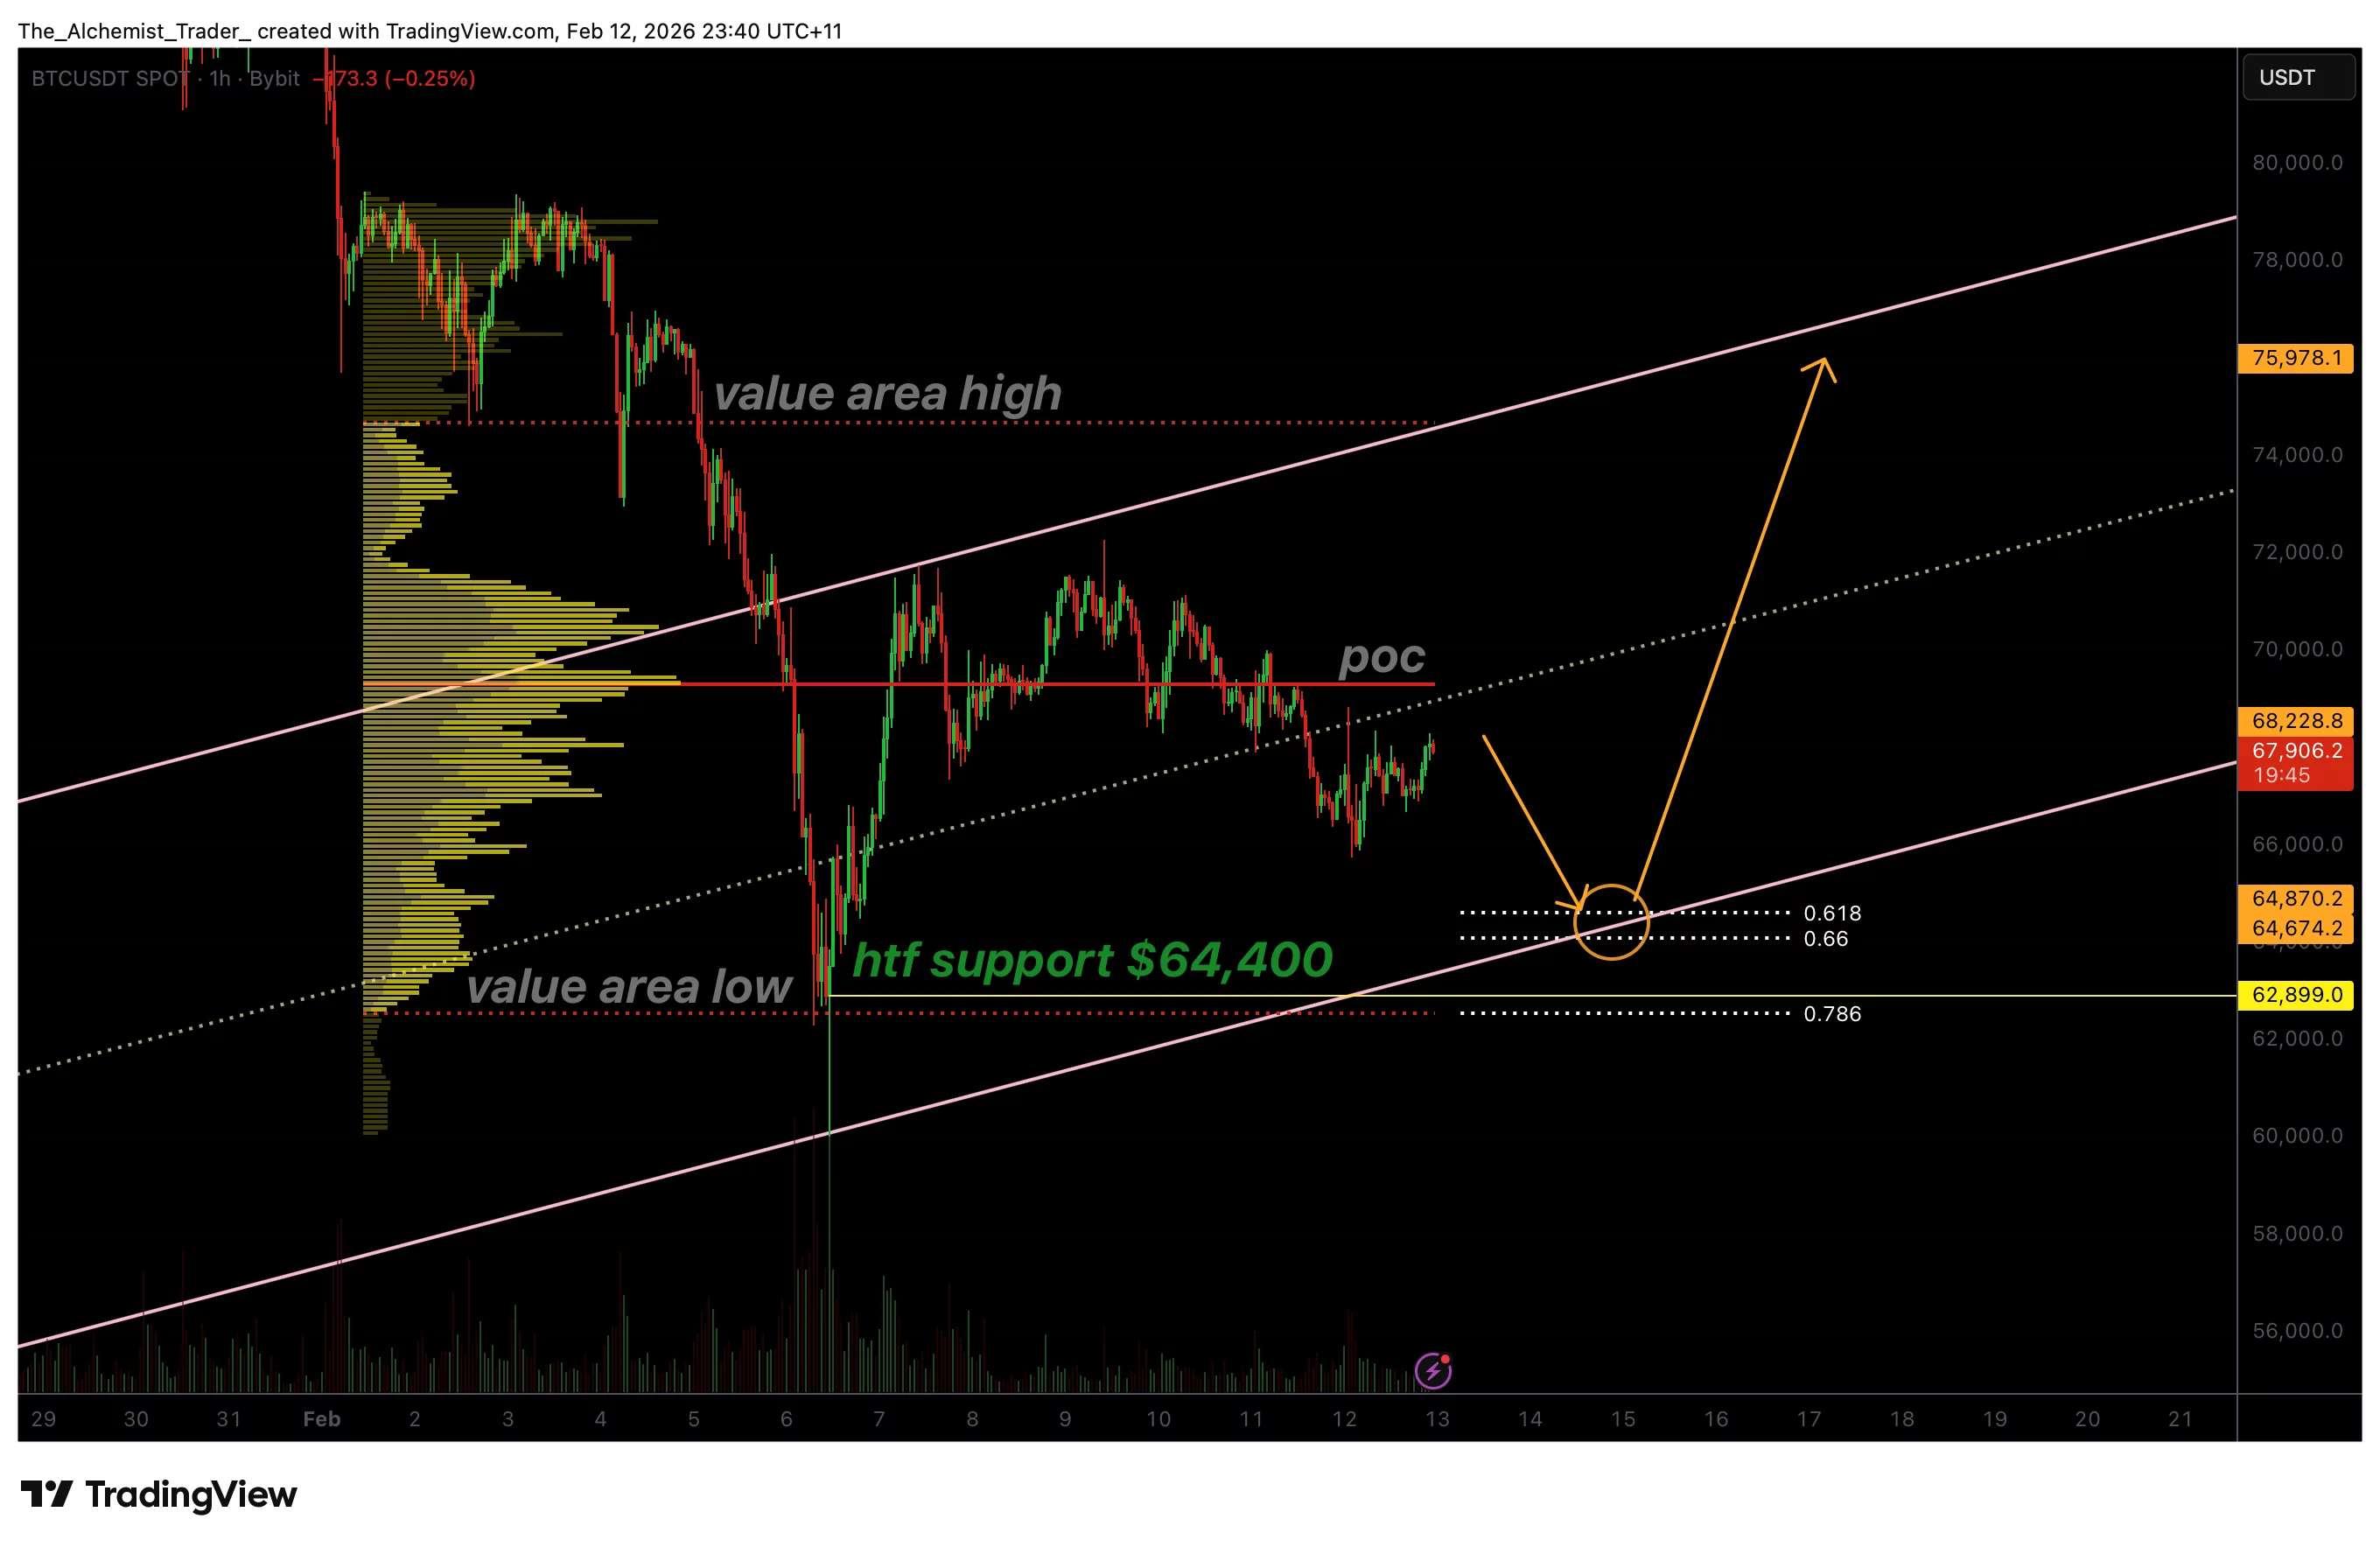
The price of Bitcoin is nearing a crucial support level around $65,000, where the intersection of Fibonacci retracement and channel support suggests the possibility of a local bottom forming before a significant relief rally takes place.
Summary
The convergence of rising channel support and the 0.618 Fibonacci retracement occurs near the $64,400 to $65,000 range.
A short-term downtrend is expected to continue until stronger support levels are tested.
An increase in bullish volume at this support zone could trigger a recovery rally toward resistance within the channel.
Bitcoin’s ($BTC) recent price movements remain corrective in nature as it continues to drift lower inside an overall ascending channel. After losing ground below the midpoint of this channel, Bitcoin has entered a weaker internal trend phase with selling pressure dominating.
Despite these short-term weaknesses, there is no indication yet that Bitcoin’s long-term upward structure has broken down. Instead, current market dynamics imply that Bitcoin might be approaching an area with high probability for temporary stabilization or bottoming out.
This scenario often precedes sideways consolidation within an uptrend where prices test deeper supports before attempting another upward move. The key question now is whether demand will emerge near the lower boundary of its rising price channel.
Key Technical Insights on Bitcoin Price
- The overall ascending channel remains intact despite losing mid-channel support recently;
- The 0.618 Fibonacci retracement aligns closely with this lower boundary around $64,400–$65,000;
- A surge in buying volume at these levels would be necessary to confirm any relief rally and continuation of bullish momentum.
Over recent months, Bitcoin has been trading within an upward-sloping channel guiding its movement. The recent breach below this midpoint marked an important shift indicating buyers lost control at higher prices. Following this breakdown in internal support levels, prices have started moving downward toward more robust structural backing found near the lower edge of that same rising range.
This pattern is typical during trending markets where instead of reversing sharply right away after hitting resistance or intermediate lows; prices tend to seek deeper liquidity pools combined with stronger technical confluences before stabilizing again. Hence what we observe currently reflects rotation inside an ongoing uptrend rather than outright reversal signals on shorter timeframes.
Notably though selling pressure hasn’t intensified dramatically—bearish volumes remain moderate—indicating controlled profit-taking rather than panic-induced sell-offs so far.
You might also like: Binance completes transfer worth $1 billion SAFU Bitcoins over 30 days
$65K Support Zone Gains Attention
A critical technical region lies between approximately $64,400 and $65K which represents overlapping factors such as strong Fibonacci retracement (0.618) coupled with structural trendline/channel floor supports acting together as probable reaction points for buyers stepping back into action.
Entering into this zone would finalize current rotational moves inside that broader ascending formation while preserving overall bullish integrity if closing above it holds steady.
This makes it one pivotal area where market participants may defend their positions aiming for continued upside momentum going forward.
“No Man’s Land” Consolidation Expected Before Testing Support Levels
Currently BTC trades amid key resistance overhead and major supports beneath—a range commonly referred to as “no man’s land.”
Within such zones price behavior tends towards indecision exhibiting choppy swings without clear directional follow-throughs.
Consolidation here serves as preparation groundwork ahead for subsequent decisive directional moves by market forces.
You might also like: Alameda shifts additional $15 million into Solana amid trader scrutiny over potential impacts
Barring breaks above reclaimed resistances or drops below established floors anytime soon,$BTC's broad sideways drift mixed with mild downward bias looks set persist temporarily — frustrating both bulls & bears alike but ultimately essential prior bigger rotations unfold later on.
Anticipated Price Behavior Moving Forward
From perspectives encompassing technical analysis alongside market structure & momentum considerations —Bitcoin appears close towards concluding its corrective rotation phase occurring presently.
Short term downside risks linger but areas spanning roughly from about $64 ,400 through $6 5 ,00 stand out prominently being likely bottoms zones offering good value entry points.
For meaningful bounce-back rallies however confirmation via visible strong buying interest must manifest including elevated volumes supporting rejection wicks plus reclaiming short term value regions.
If those criteria get fulfilled then BTC may well rebound targeting upper limits defined by existing rising channels potentially eyeing next big hurdles located near $75 ,000 territory.
Read more: Sam Bankman-Fried bets on Trump crypto pardon in latest prison rant.