Historical data suggests that Bitcoin, currently within the capitulation zone, is nearing a critical point where its price typically bottoms out and begins to rebound.
This development would bring relief to steadfast investors who have endured several months of declining prices. Notably, Bitcoin ($BTC) has experienced a downtrend lasting four months, with most indicators hinting at a potential fifth month unless there is a significant shift in momentum before February concludes.
Key Insights
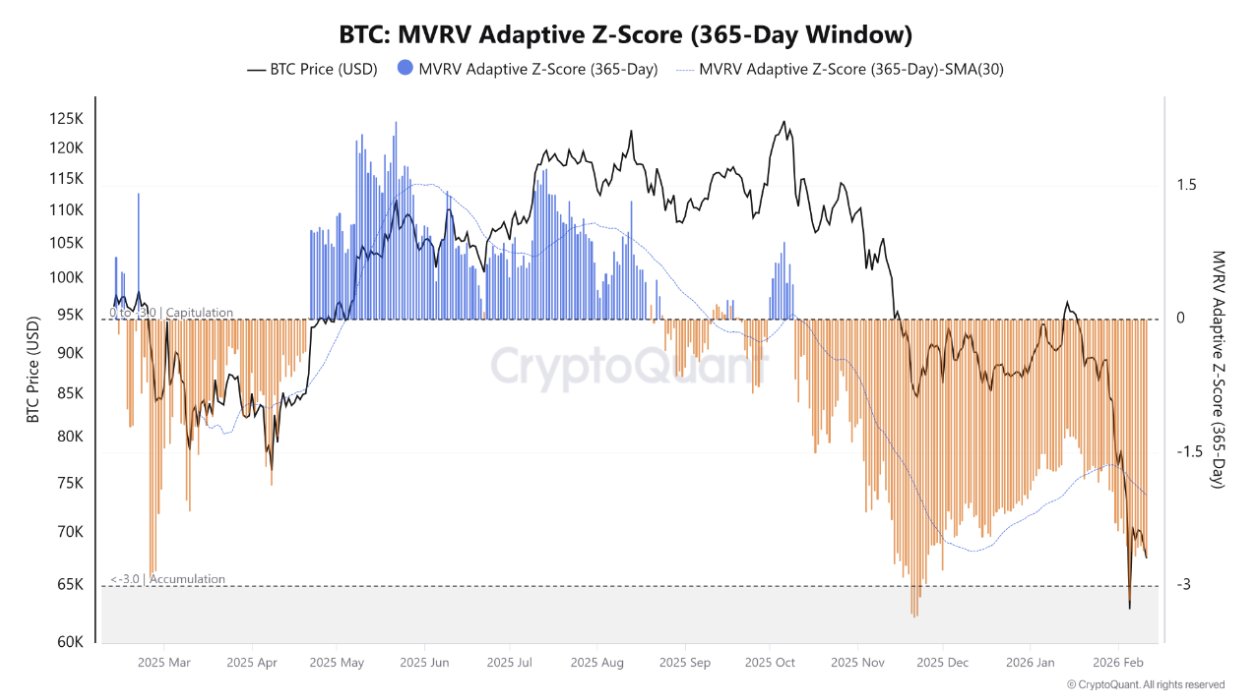
The Bitcoin Market Value to Realized Value (MVRV) Adaptive Z-Score reveals that $BTC remains in the capitulation phase.
At present, this metric stands at -2.66, firmly within the capitulation range.
Despite this bearish signal, the MVRV Adaptive Z-Score suggests we are approaching an important historical accumulation stage where Bitcoin’s price tends to stabilize and bottom out.
If this holds true, it could represent an excellent buying opportunity as market sentiment might soon pivot towards bullishness.
Bitcoin’s Current Capitulation Status
A recent study by on-chain analytics firm CryptoQuant brought some hopeful news amid ongoing corrections for $BTC. The report from verified analyst GugaOnChain utilizes the MVRV Adaptive Z-Score metric to determine which phase of its market cycle Bitcoin currently occupies.
The findings indicate that Bitcoin is entrenched in the capitulation phase characterized by high volatility and dominant downward pressure. While occasional relief rallies occur—such as the brief surge from $60K to $70K between February 5th and 6th—the overall trend remains bearish.
The MVRV Adaptive Z-Score assesses whether Bitcoin is undervalued by comparing its current market value against realized value—the average price at which coins last moved on-chain by holders.
This score of -2.66 places it squarely inside capitulation territory; scores between 0 and -3 denote capitulation while values below -3 mark accumulation phases where prices tend to stabilize further downward before recovery begins.
A Word of Caution
While still entrenched in capitulation according to these metrics, signs suggest we may be nearing an accumulation period historically associated with bottoming out—implying sellers are losing steam and buyers might soon gain control again.
This scenario presents a compelling entry point for investors anticipating a reversal toward upward momentum after prolonged correction phases end during accumulation stages when demand picks up strongly again.
Is This Really The Bottom?
However optimistic this outlook may appear, some experts offer contrasting perspectives. For instance, XWIN Research recently argued that Bitcoin remains early into what they classify as a bear market rather than experiencing just temporary sideways movement typical within bull markets’ retracements.
Additionally, other analysts predict further declines ahead: veteran trader Peter Brandt points toward potential lows near $42K based on his well-known banana chart analysis; meanwhile Kalshi trading data shows growing bets on prices dropping below $48K before year-end among traders betting against current levels for BTC gains or losses alike).
The divergence among expert opinions adds layers of uncertainty around future directions for crypto markets generally—and specifically regarding what lies next for bitcoin pricing trends—which should become clearer over coming days as new data emerges confirming or refuting these hypotheses about whether we’ve truly hit rock bottom yet or not.