The recent downturn in Bitcoin’s value has sparked a significant wave of selling throughout the cryptocurrency market, with no signs of slowing down soon. Currently trading under $90,000, Bitcoin faces several potential outcomes depending on its next price movement. The ongoing battle between bullish and bearish forces means that either upward or downward momentum is possible. Key price levels are at stake, prompting a crypto analyst to evaluate the potential impacts of each scenario.
Possible Directions for Bitcoin’s Price Movement
Crypto expert HAMED_AZ has examined Bitcoin’s price chart to identify current trends and what might trigger either a rebound or further decline. According to the analyst, Bitcoin is presently undergoing a corrective phase that started after reaching an all-time high near $126,000. Since then, it has lost over $35,000 in value.
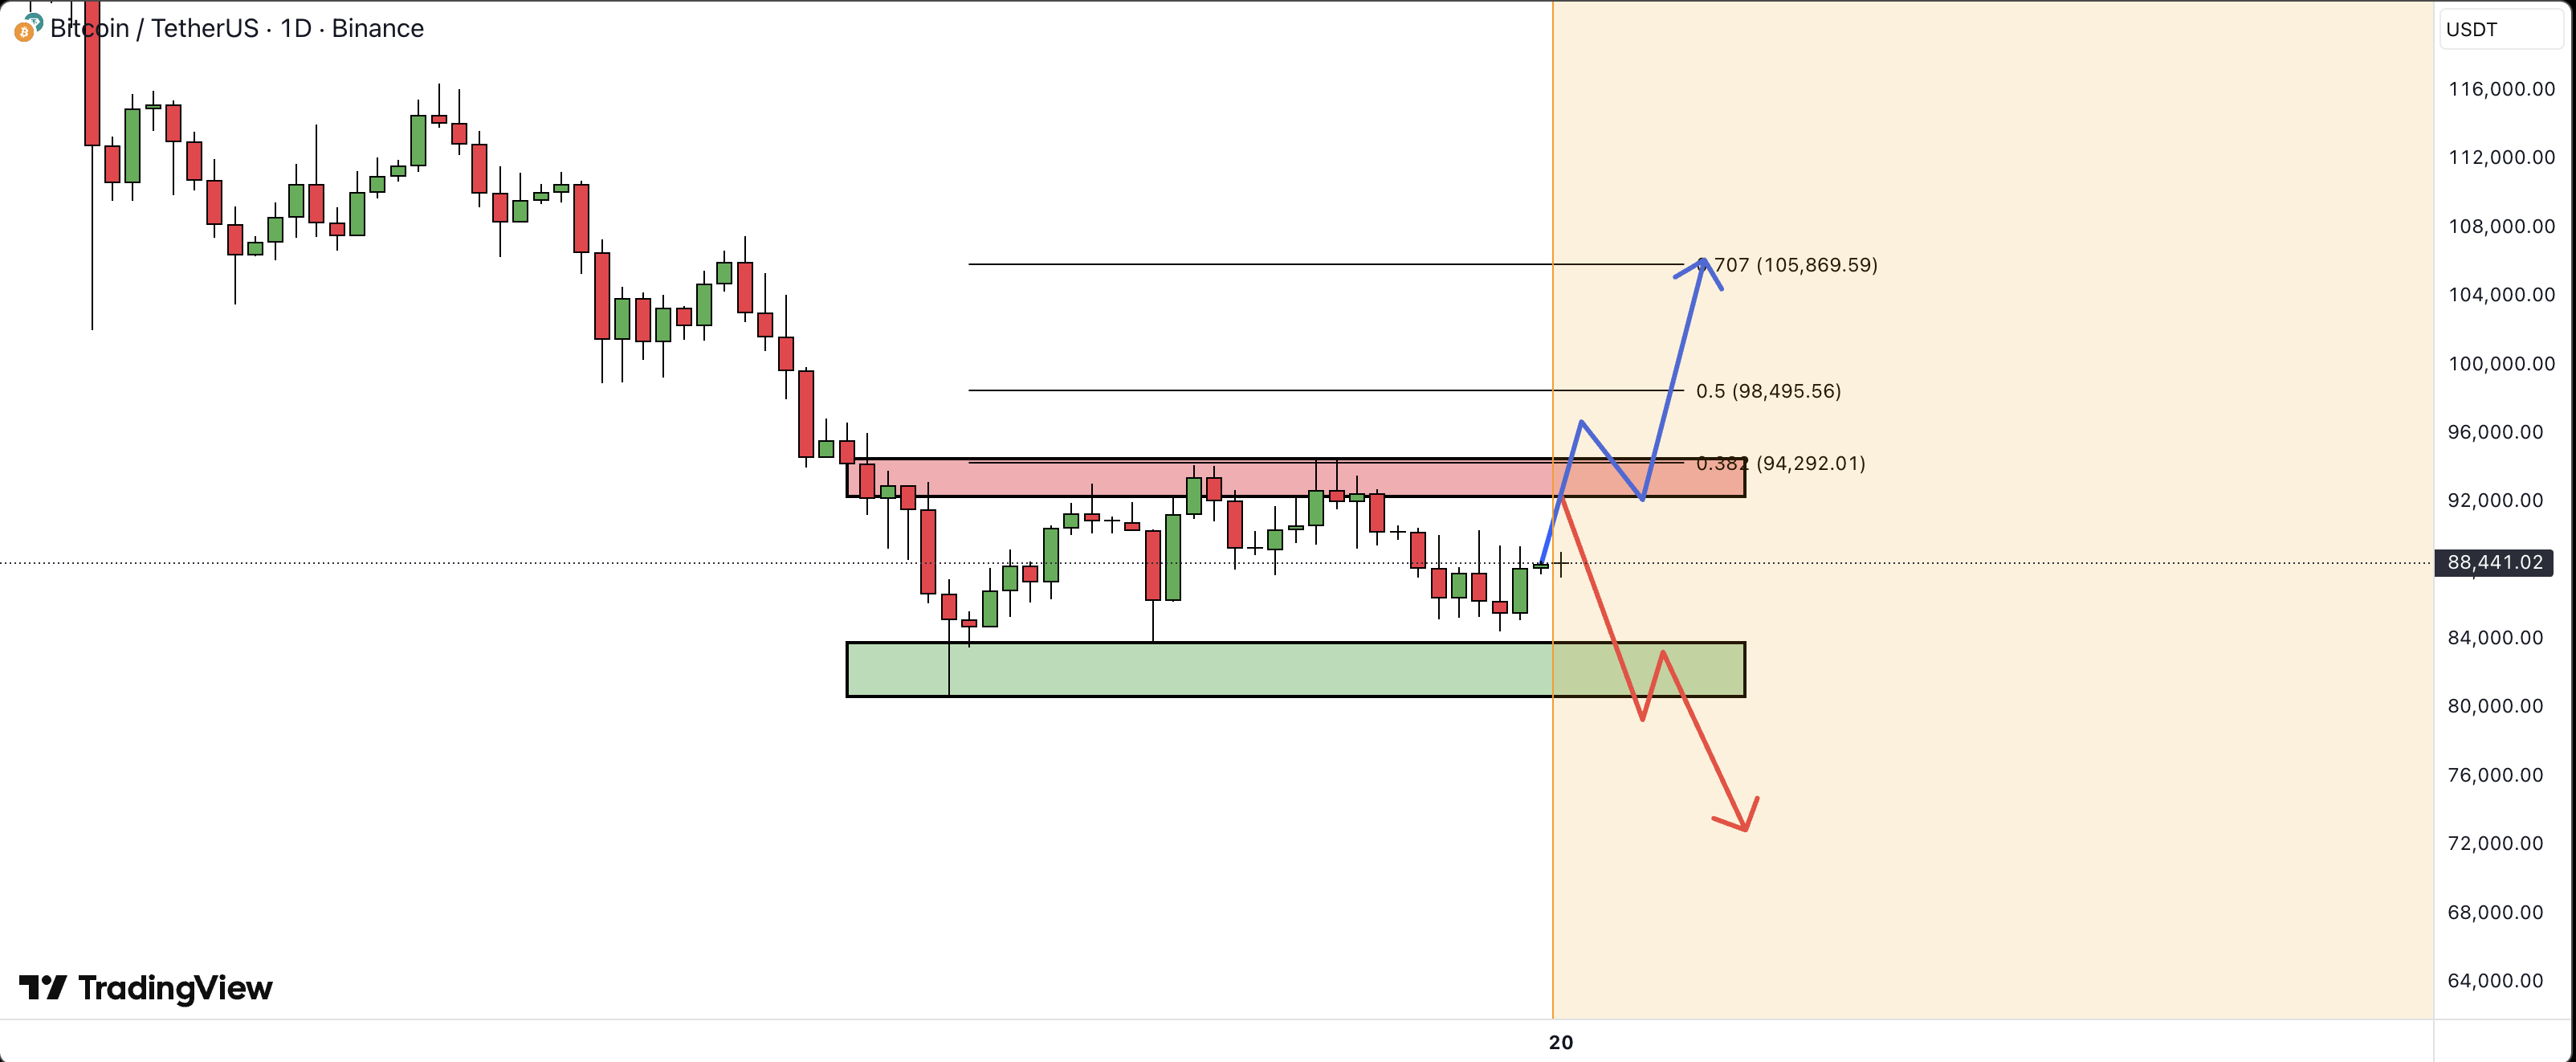
This correction has confined Bitcoin within a narrow trading range between $84,000 and $94,000—levels that have historically acted as strong support and resistance points. These boundaries will be crucial in determining where the price heads next.
If Bitcoin continues to trade within this range without breaking out above resistance or falling below support, major moves are unlikely. The decisive shift will occur only when one of these critical levels is breached by either buyers or sellers gaining control.
Key Bullish and Bearish Scenarios
On the bullish side, if buyers manage to overcome the persistent resistance around $94,000—which has been tested multiple times recently—it could signal renewed strength for Bitcoin’s price action. Such a breakout would likely push prices toward retesting higher thresholds.
If this upward breakout holds firm beyond resistance levels successfully failing to contain gains again—and surpasses psychological barriers like $100K—the analyst predicts momentum could carry prices up as high as approximately $108,000 before encountering significant selling pressure.
Conversely though, bears may seize control if they force prices below critical support at about $84K—a level which previously served as key defense during earlier declines. Losing this foothold might trigger accelerated selling pressure potentially driving prices down toward near-term lows around $72K.
Featured image courtesy of Dall.E; chart sourced from TradingView.com