Elon Musk’s assertion that “energy is the true currency” has reignited discussions surrounding Bitcoin, despite the absence of any new backing. Concurrently, TradingView charts have highlighted a resistance level at $90,000 and a significant weekly support line that traders are closely monitoring.
Musk Associates Energy with Value as Bitcoin Discussions Resurge
In his recent comments, Elon Musk emphasized that energy serves as the genuine form of currency rather than traditional fiat money. This statement has sparked renewed debate about Bitcoin but did not include any explicit endorsement from him.
During a public dialogue, Musk argued that energy is fundamental to all economic activities and ultimately determines value. He previously described fiat systems as fragile and framed his critiques around long-term sustainability instead of immediate policy issues. Consequently, his remarks quickly gained traction on social media platforms like X, where users connected them to Bitcoin’s energy-centric design.
Forbes noted that this comment has stirred speculation among Bitcoin enthusiasts who interpret it as supportive of Bitcoin’s proof-of-work model. However, the publication pointed out that these discussions reflect personal interpretations rather than confirmation of Musk’s support for or increased involvement in Bitcoin.
Musk has acknowledged in the past that Bitcoin’s operation depends on energy consumption while maintaining distance from daily market narratives. He hasn’t revealed any new investments in or strategic changes regarding Bitcoin recently; thus current speculation revolves around commentary rather than disclosed actions related to it.
Wyckoff Accumulation Indicates Potential $90K Breakout While BTC Maintains Its Range
Meanwhile, Gert van Lagen analyzed a Wyckoff accumulation pattern on an hourly chart for Bitcoin and indicated that a decisive break above the approximately $90,000 resistance zone would signify strength and complete Phase D of this setup. The chart created on TradingView shows BTC‘s movement remaining flat beneath substantial resistance after experiencing both sharp declines and recoveries.

This analysis highlights classic Wyckoff milestones: prices reach a selling climax near mid-$80k levels before rebounding into an automatic rally followed by revisiting lows through springs and tests. Subsequently, BTC establishes multiple last points of support close to its upper range while candles repeatedly close within this band—indicating buyers are defending dips yet still contend with overhead supply pressures.
The key levels are clearly defined: upper resistance lies around $89,531 while lower range support hovers near $88,332 with nearby reference points at approximately $88,167. On the downside spectrum lie major support lines positioned near $85,616 and $84,484—marking boundaries for accumulation zones.
The breakout condition remains straightforward according to van Lagen’s interpretation: BTC must surpass ±$90k territory then maintain position above it; additionally volume must increase to validate such movements effectively. Without noticeable volume spikes accompanying price action during breakout attempts could lead back into previous ranges prior to potential Phase E developments occurring later on.
Bitcoin Retains Gaussian Channel Support While Weekly Structure Remains Stable
A prominent analyst known as Man of Bitcoin stated recently how constructive conditions persist for BTC so long as its price stays above lower limits established by Gaussian channels observed within weekly charts contextually speaking . Currently ,the TradingView graph indicates BTC trading roughly at 88 ,400 dollars whilst remaining above green bands guiding overall upward trends since recovery initiated earlier this year (2023).
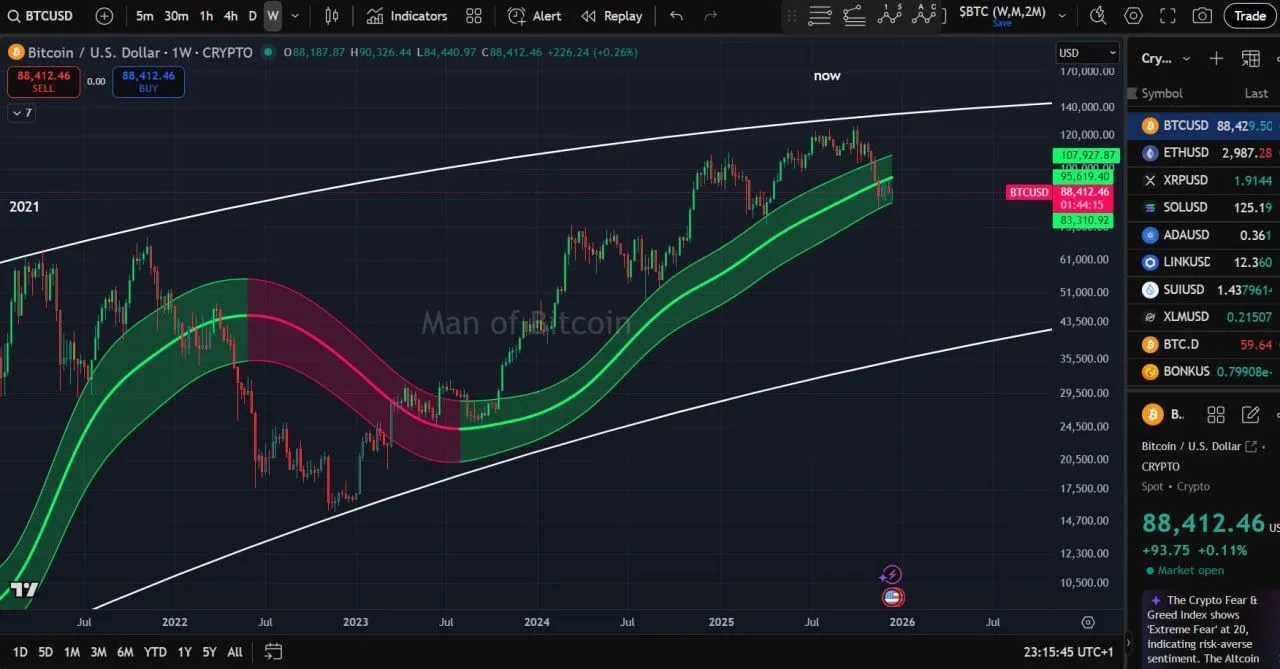
This Gaussian channel tracks trend momentum by smoothing prices into dynamic zones representing both supports/resistances . In present circumstances ,the lower boundary rests just below current valuations acting crucially important technical threshold ;as long weekly candles continue closing beyond said limit structure signals continuation trends instead breakdown scenarios emerging thereafter .
The visual also illustrates how well entrenched inside longer-term rising channels originating from cycles seen back during 2021 period -despite recent pullbacks witnessed higher up towards 110 k dollar marks- no violations occurred against either lower gaussian bands nor broader channel floors indicating consolidation taking place under existing trends rather confirmed reversals happening anytime soon!
The analyst underscored significance behind weekly closures outweighing intraday fluctuations altogether! Sustained closes dropping beneath those critical gaussian boundaries would weaken bullish structures shifting focus onto deeper supports awaiting discovery until then trend frameworks remain intact favorably positioned concerning bitcoin assets ! </P