As of 8:30 a.m. Eastern Time on March 28, 2026, Bitcoin was trading just above $66,000 per coin. The cryptocurrency exhibited limited movement throughout the day as momentum appeared to wane across various timeframes. The overall technical landscape indicated that prices were holding close to short-term support but remained significantly below key moving averages, which contributed to a cautious sentiment in the market.
Is Bitcoin Poised for Another Decline? $BTC Tests Vital $65.5K Support Level
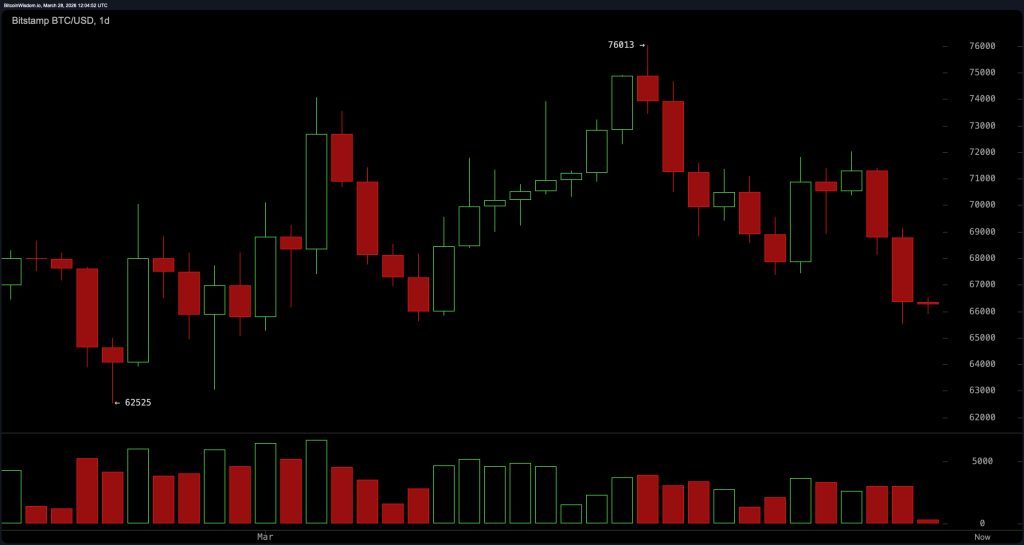
The daily chart for Bitcoin revealed an ongoing downtrend following a peak around the $76,000 mark. Currently, the price range between $66,000 and $67,000 has formed tentative support; however, the failure to regain higher levels indicates ongoing weakness in the market.
If Bitcoin falls below $65,000, it could drop further toward $62,000. Meanwhile, resistance is firmly positioned between $70,000 and $72,000—leaving Bitcoin in a precarious situation despite some short-term stabilization.
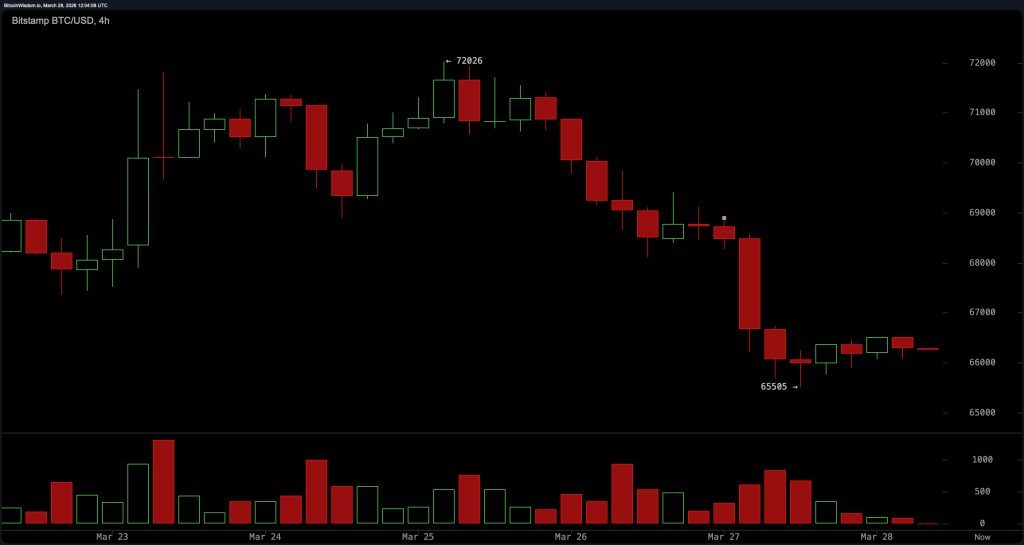
The four-hour chart indicates that market dynamics remain clearly defined by lower highs and persistent selling pressure. A sharp decline to about $65,500 was followed by minimal consolidation without any clear reversal signals emerging. Resistance continues at approximately $68-69K range suggests that upward movements are being absorbed rather than sustained; this pattern aligns more with continuation than reversal behavior unless there’s a significant change in momentum or volume growth.
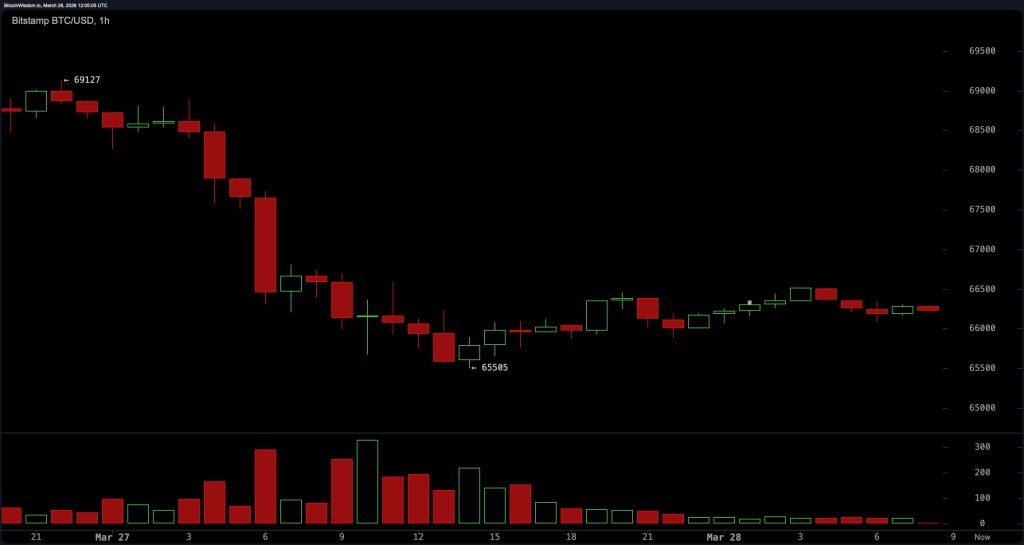
The one-hour chart illustrates a phase of compression where Bitcoin trades within roughly between$65-66K range with candlestick bodies narrowing alongside declining volume—a sign of indecision among traders. Such range-bound activity often precedes increased volatility; however direction remains uncertain as neither side shows strong conviction—indicating participants may be waiting for an external catalyst before making significant moves.
Oscillators present mixed signals but generally lean towards subdued momentum—the relative strength index (RSI) stands at 41 indicating neutral conditions while both Stochastic and commodity channel index (CCI) hover within non-committal ranges despite negative readings from CCI itself.
The average directional index (ADX) reading at 16 points towards weak trend conditions overall while both Awesome oscillator and moving average convergence divergence (MACD) reflect negative trends slightly offset by positive readings from other indicators like momentum leaving oscillators broadly neutral yet not particularly optimistic either way.
Moving averages convey clearer messages with all major periods’ structures firmly overhead—exponential moving average (EMA) along with simple moving average(SMA), ranging from around$68K(EMA10)&$69K(SMA10), up through approximately$85K(EMA200)&$91K(SMA200). This configuration underscores strong downward bias suggesting any upward movement must first navigate through dense clusters of resistance levels ahead of it .
Bullish Outlook:
Bitcoin is currently maintaining crucial short-term support near$65-$66k while showing neutral rather than overtly negative momentum patterns.A sustained move above67k especially if accompanied by increasing volumes would indicate potential shifts toward68k & even70k challenging existing bearish trends observed recently .
Bearish Outlook:
Bitcoin remains under pressure trading beneath all significant moving averages reflecting multi-timeframe structures characterized predominantly lower highs & consistent resistances overhead.A breakdown below55-56k would affirm continuation current trend exposing possible declines towards64&62ks as weak bullish pressures combined supply limits upside participation further .
FAQ 🔎
What is bitcoin’s price outlook on March 28 ,2026 ? Bitcoin consolidating near66 k displaying neutrality bearish technical biases across key timelines.
Why does bitcoin struggle beneath70 k ? Strong resistances coupled lack positive trending indicators keeps BTC trapped below major MAs.
What are essential supports/resistances level for BTC? Support found closearound55 -56 K whereas resistances clusterbetween67 -70 K regionally.
Is breakout or breakdown likely next ? Current compressions hint pending movements favoring downside unless resistant breaks occur swiftly thereafter!