Bitcoin’s recent decline has sparked growing worries that its upward momentum might be nearing a crucial inflection point.
Mike McGlone, a senior commodity strategist at Bloomberg Intelligence, interprets Bitcoin’s drop below the $70,000 mark as an indication of a broader correction following years of speculative exuberance.
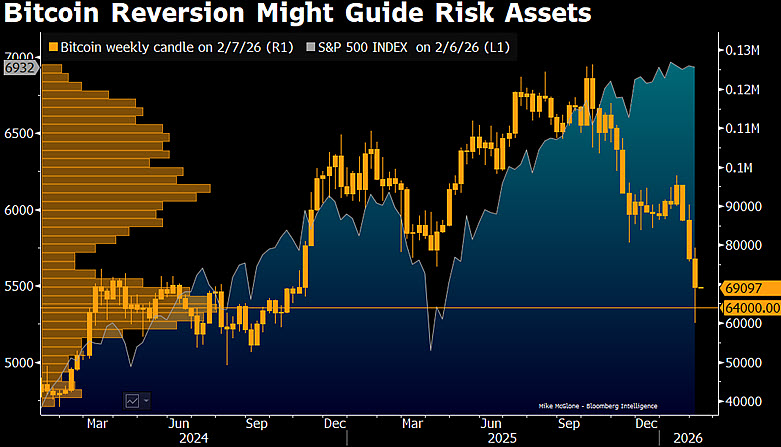
In a post on X dated February 7, McGlone explained that Bitcoin emerged in the aftermath of the global financial crisis—a period characterized by abundant liquidity that fueled prolonged inflation in risk assets. As this cycle matures, Bitcoin seems to be reverting toward its historical average and most commonly traded price range near $64,000.
He reinforced his viewpoint with a weekly chart illustrating multiple tests around the mid-$60,000 level. Volume data further underscores significant trading activity near $64,000, suggesting this price acts as key support absorbing selling pressure during recent downturns.
The Ripple Effect of Bitcoin’s Decline on Stock Markets
A comparison with the S&P 500 index reveals Bitcoin’s function as an early gauge for overall risk sentiment. Historically, prolonged weakness in Bitcoin has coincided with or even foreshadowed declines in equity markets. Given current elevated stock levels, failing to maintain support at $64,000 could indicate mounting stress across various risk assets.
“The chart illustrates Bitcoin gravitating back to its mean and mode from election year levels around $64K—a critical threshold. Should this level break downwards, a cascade effect may follow, pushing stocks lower next,” says McGlone.”
He warned that dropping decisively below this benchmark might accelerate downward momentum and trigger widespread reassessment of exposure to risky investments—potentially impacting equities and other sensitive markets alike.
The Volatility Surrounding Bitcoin Prices
This perspective comes amid a modest recovery after an intense week where BTC briefly dipped under $61K—confirming deepening bearish trends. Since reaching nearly $126K in October 2025 (its all-time high), BTC has lost close to 45%, wiping out gains made post-election and entering what analysts call classic crypto-winter territory.
Between February 5th and 6th,$<a href="https://cryptonews.net/market-cap/bitcoin/">BTC</a> experienced its sharpest single-day fall since late 2022—plunging by about 15% before rebounding sharply by roughly 11%, temporarily pushing prices above $70K again.
This crash was driven by multiple factors: macroeconomic uncertainties such as tariff disputes and doubts over Federal Reserve policies combined with increased volatility across risk assets. Additionally, a reversal occurred within institutional flows into U.S.-based bitcoin ETFs which saw net outflows early in 2026 after previously strong inflows.
On-chain indicators paint mixed pictures: retail investors are aggressively buying dips near support zones between $60K–$63K while larger holders have been offloading positions limiting upward potential.
At press time,BTC was trading around $69&comma464&comma marking approximately two percent gains over twenty-four hours but still showing about eleven percent losses on weekly charts.
Image courtesy Shutterstock