A cryptocurrency expert known as Pure has suggested that the phenomenon of the blood moon might be influencing Bitcoin’s price movements. By examining past patterns, Pure proposed that this celestial event could signal a potential surge in Bitcoin’s value, possibly pushing it beyond the $100,000 mark.
Bitcoin Could Surge Past $100,000 According to Historical Patterns
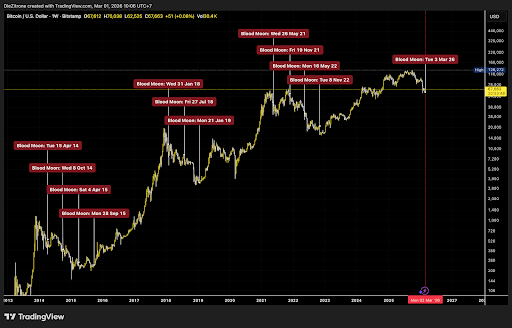
In a recent post on X (formerly Twitter), Pure highlighted a possible link between Blood Moon occurrences over the last twelve years and Bitcoin’s price trends. The analyst shared a chart indicating that Bitcoin ($BTC) may soon experience an upward rally exceeding $100,000 and potentially approach its all-time high of approximately $126,000. The data also revealed that each of the previous three Bitcoin market cycles featured at least three Blood Moons.
Interestingly, in those earlier cycles, the third Blood Moon often coincided with a bottoming out phase for Bitcoin’s price before it surged to new highs. This cycle is expected to witness its third Blood Moon following those on March 14 and September 7 of last year. If history repeats itself, this could mean another bottom formation for $BTC.
Pure further mentioned that after tomorrow’s Blood Moon event, there won’t be another one for three years. This suggests that this particular lunar occurrence might represent an important low point in this cycle since no other blood moons will follow soon after. The analyst hinted this could indicate an end to maximum market pain and hint at an upcoming bullish reversal for Bitcoin.
$BTC Remains Within Bear Market Despite Possible Short-Term Recovery
Market strategist Benjamin Cowen emphasized that despite any short-term rebounds possibly triggered by geopolitical tensions such as those between the U.S. and Iran, $BTC remains entrenched in a bear market phase. In his post on X platform, Cowen explained how risk assets typically experience sell-offs followed by temporary recoveries when major conflicts arise.
Cowen pointed out if Bitcoin rallies under these conditions again—as seen previously—it would likely form a lower high around March similar to what happened in 2022 during escalating global tensions.
The analyst also noted bear markets generally unfold over extended periods. His chart illustrated how after Russia invaded Ukraine in 2022 causing initial bounces for $BTC, prices eventually formed lower highs leading into deeper declines before finally bottoming out towards year-end 2022—aligning with his forecasted bottom occurring late this year.
At present writing time according to CoinMarketCap data, Bitcoin trades near $66,600 but has declined within the past day.
Image credits: Getty Images; Chart source: Tradingview.com