Bitcoin’s price has remained confined within a narrow range, fluctuating between $87,831 and $88,067 over the past hour, mirroring yesterday’s indecisive market behavior. With a market capitalization of approximately $1.75 trillion and a moderate 24-hour trading volume around $35.5 billion, bitcoin appears to be consolidating for now. The last 24 hours have seen prices oscillate between an intraday low of $86,855 and a high near $88,037, reflecting a subtle battle between buyers and sellers.
Analysis of Bitcoin Price Trends
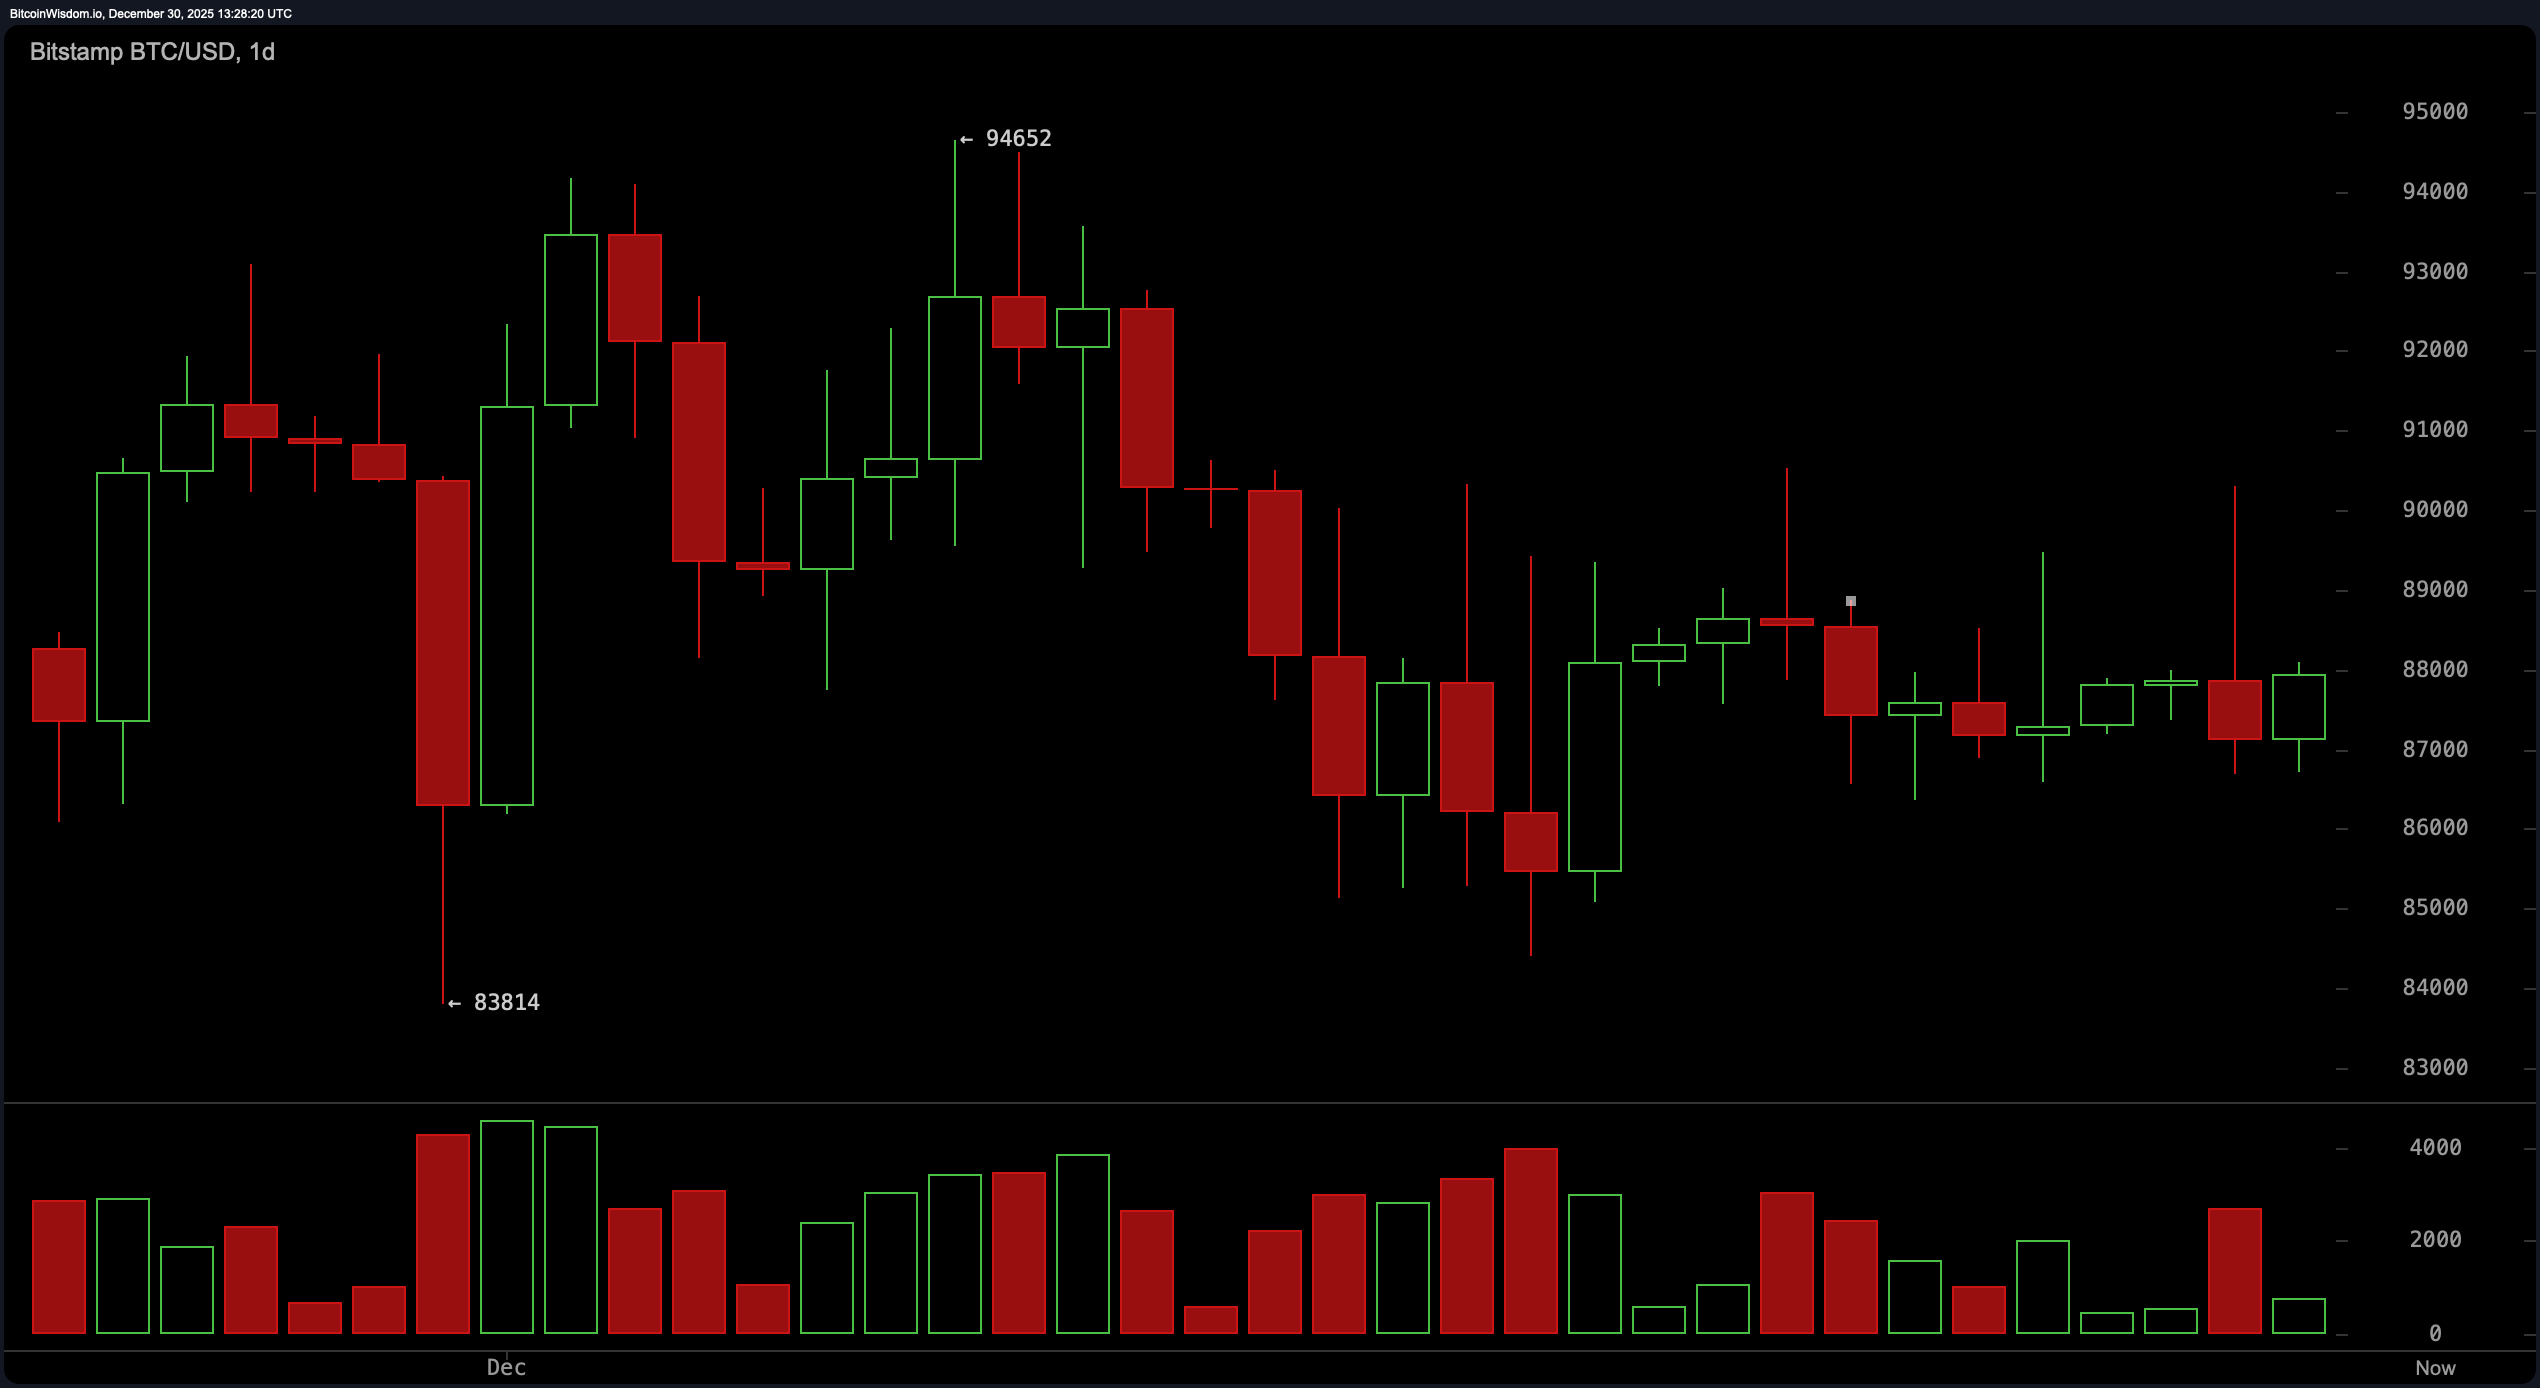
Examining the daily chart reveals that bitcoin is currently in a cooling-off phase following its decline from recent highs close to $94,652 per coin. The pattern shows lower peaks forming as the price recently found support at about $83,814 but struggled to break above resistance levels near the $89,000–$90,000 zone.
The candlestick formations suggest uncertainty among traders: small bodies combined with low trading volumes indicate hesitation in committing to either direction. A sustained move above roughly $88,800 would require increased volume to confirm bullish momentum; conversely falling below approximately $86,500 could signal that bearish forces remain dominant.
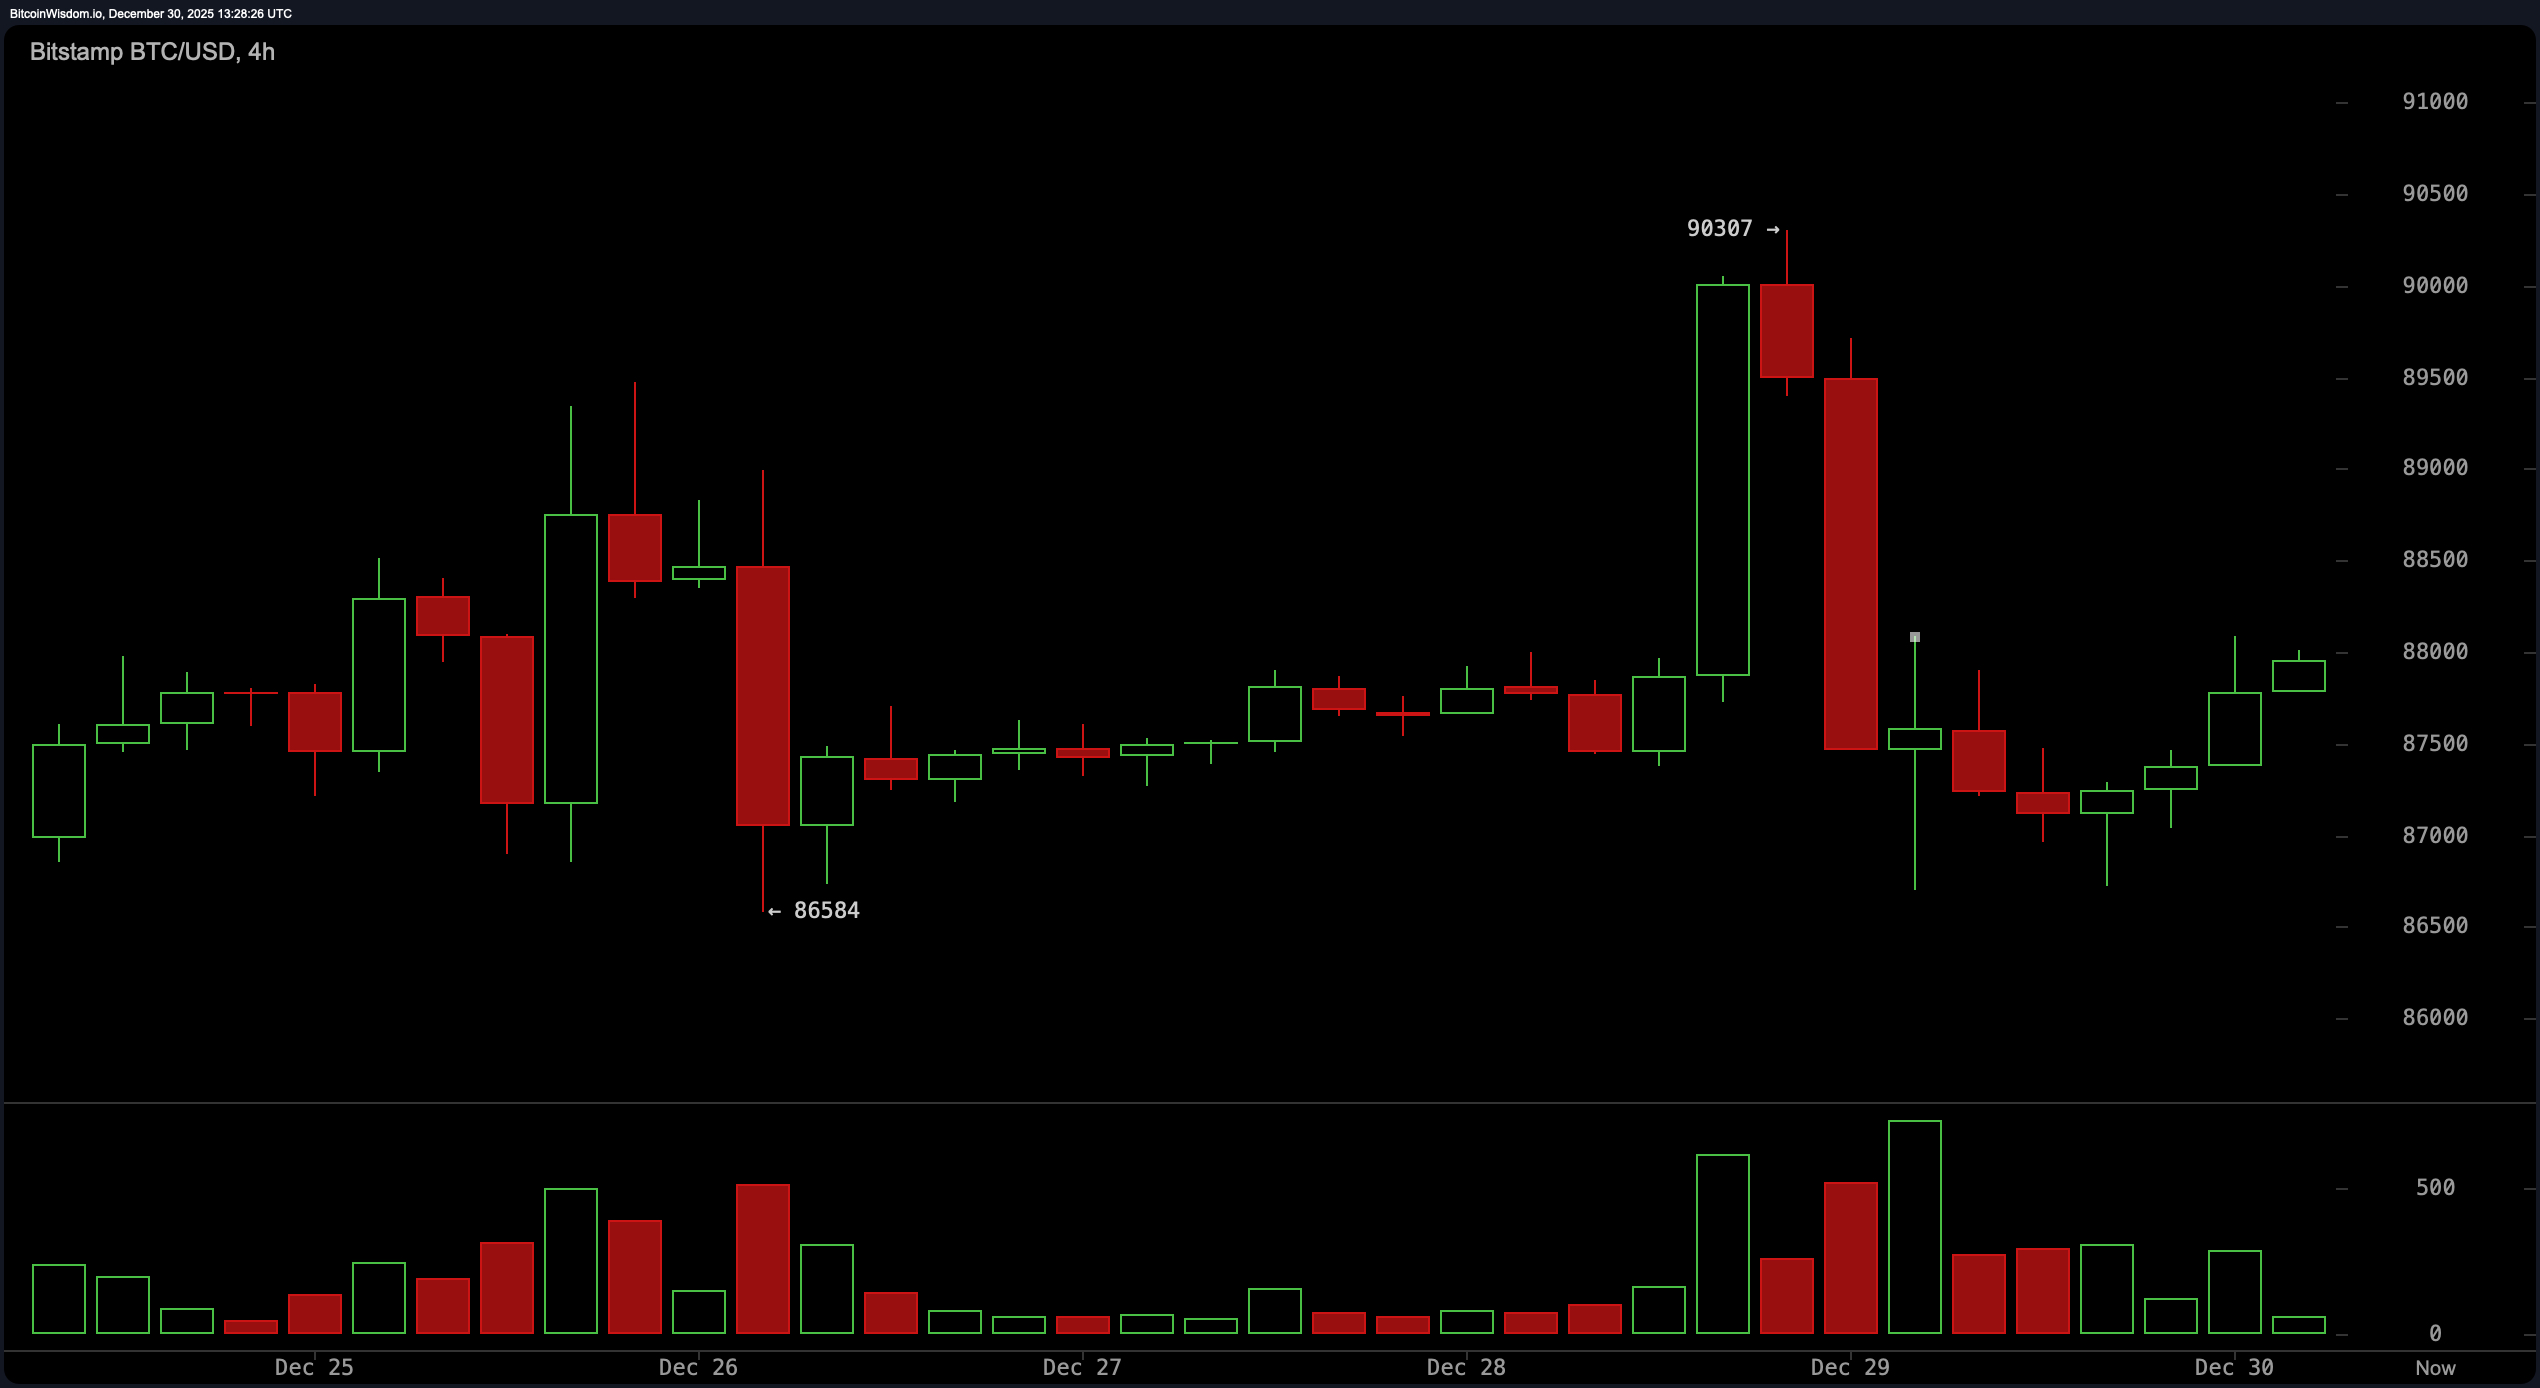
Zooming into shorter timeframes like the 4-hour chart reveals signs of weakness after bitcoin dropped sharply from around $90,307 down to about $86,584 before attempting an incomplete recovery back toward the mid-$88K range. Resistance remains firm near the level of approximately $88,200 while support zones hold steady between roughly $86,500 and $86 ,800.
The momentum on this timeframe is fragile — each upward push lacks strong conviction as evidenced by declining volume figures. Traders monitoring these intervals should stay alert for potential breakout opportunities but also be prepared for rapid reversals depending on volume confirmation.
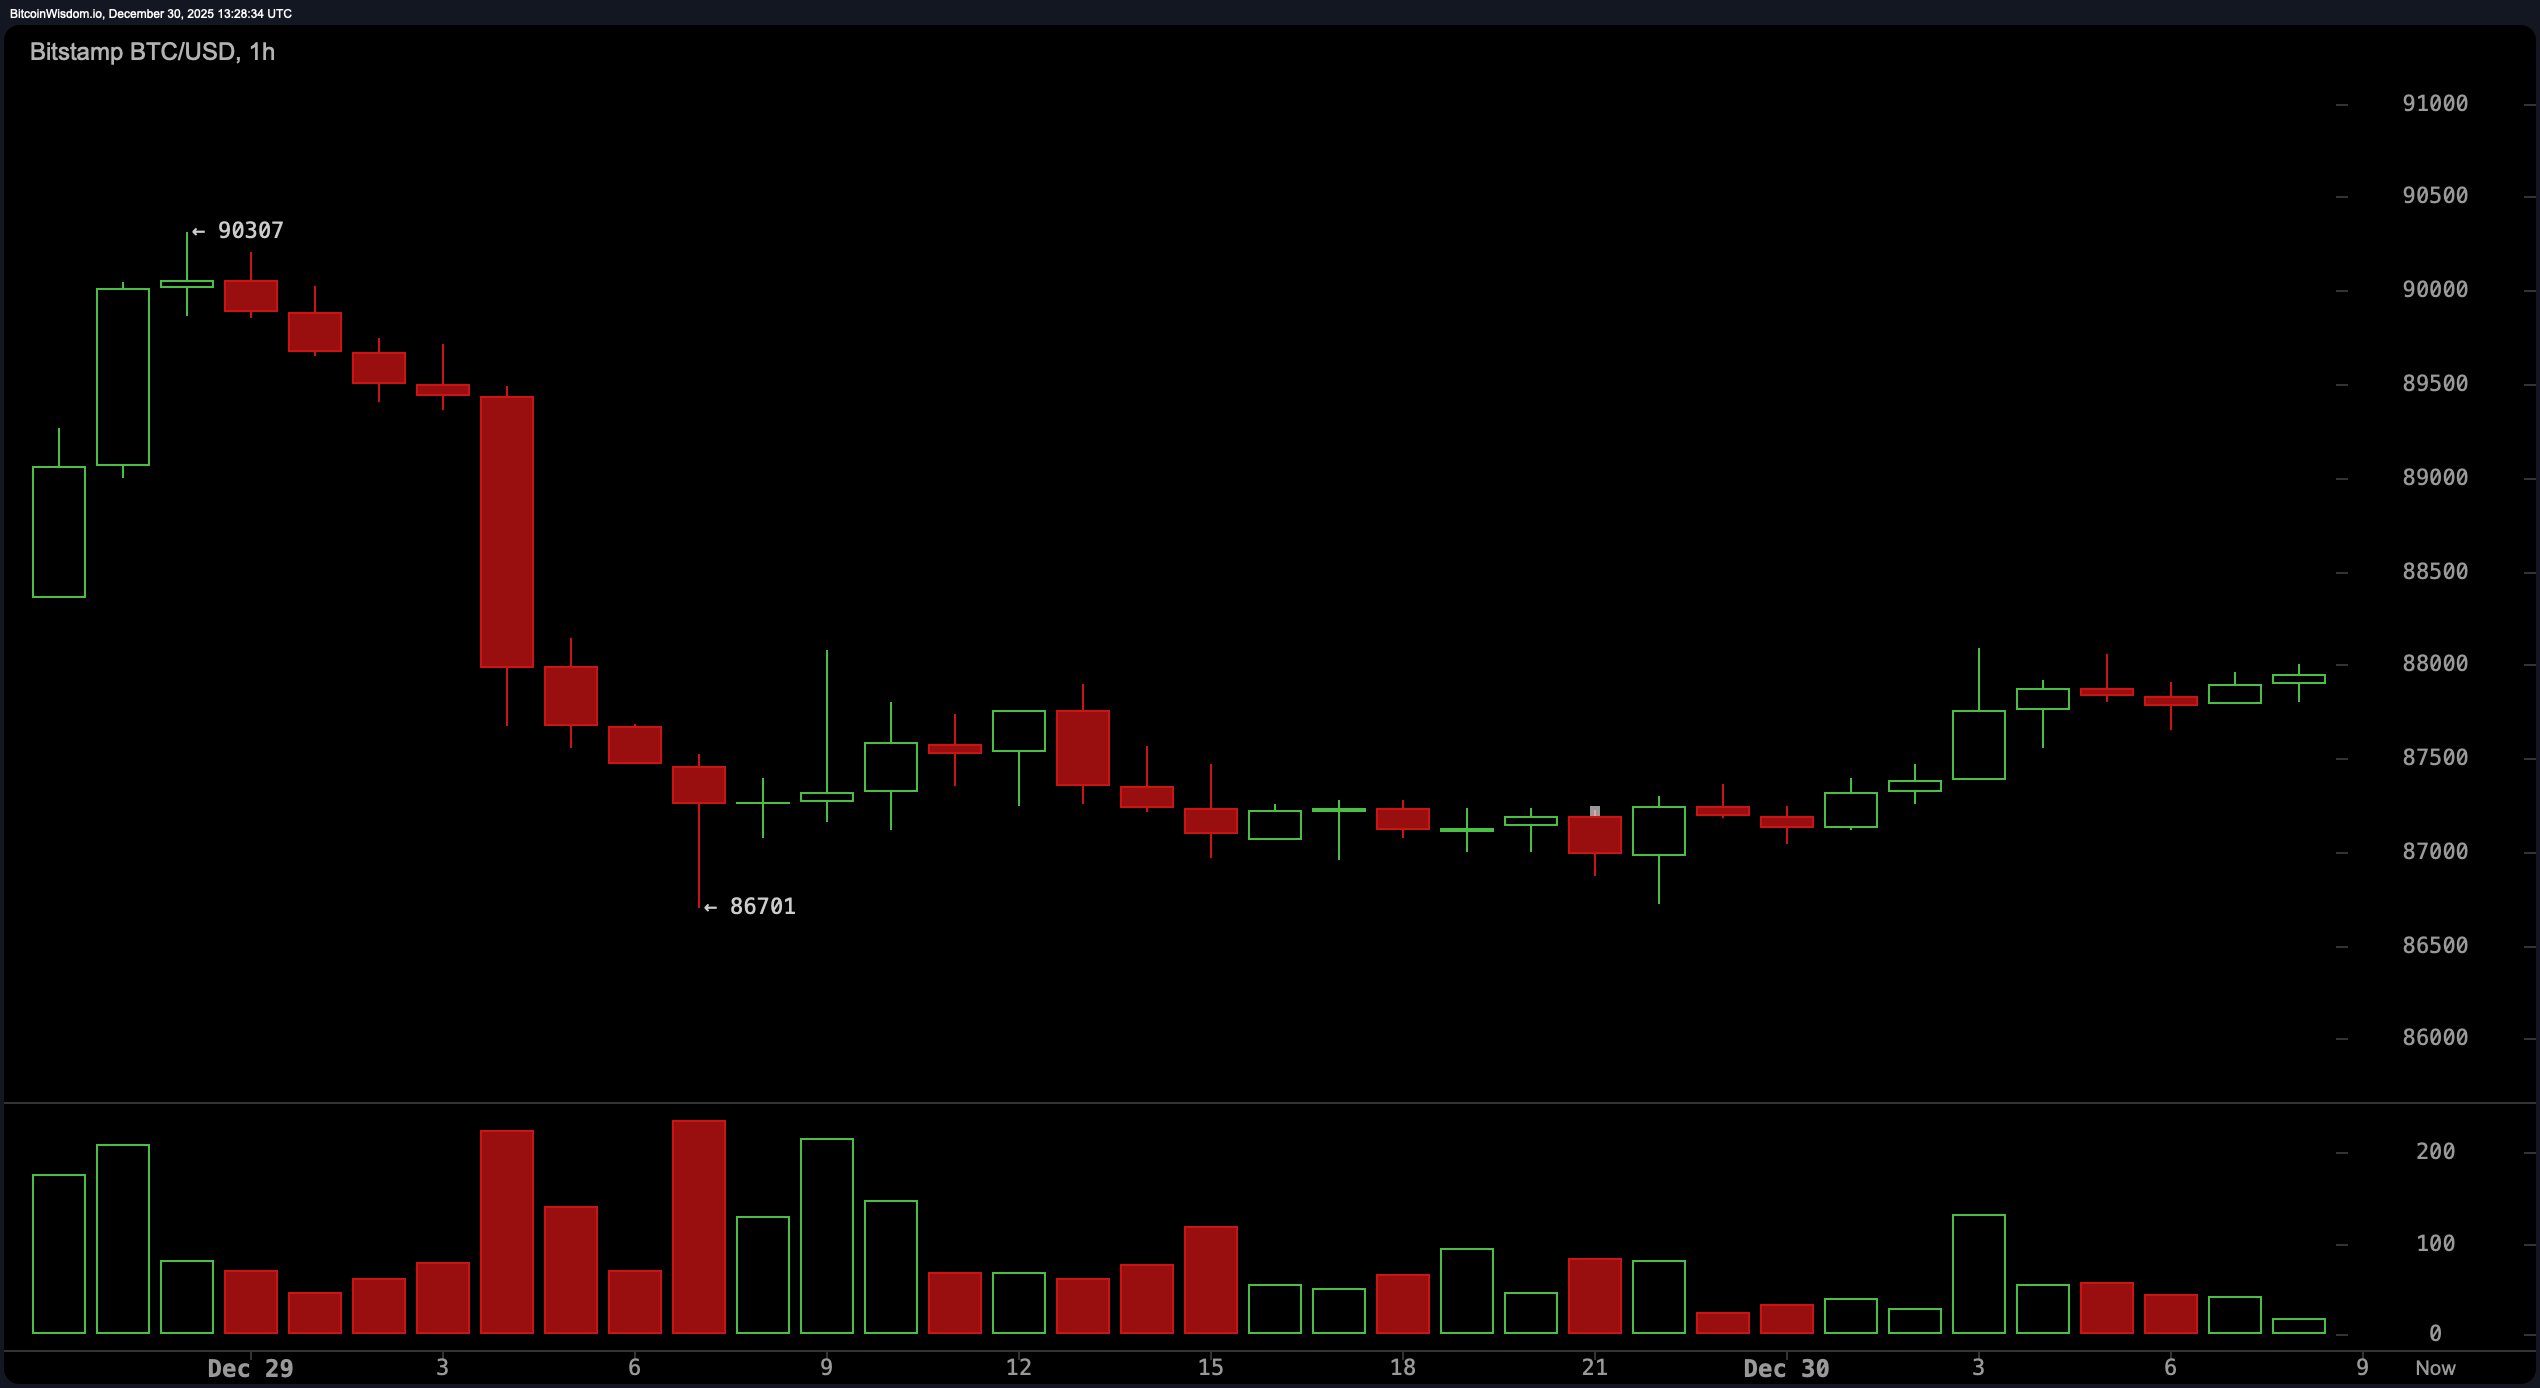
The hourly chart paints a cautiously optimistic picture yet warns against premature enthusiasm. After plunging from about $90 ,307 down close to $86 ,701 recently , bitcoin is trying to regain footing with what looks like rounded bottom formation hovering near resistance at around $88 ,000—a level acting as significant barrier much like bouncers guarding entry at an exclusive venue . Although candles show slightly more positive sentiment than before , overall momentum remains tenuous .
Technical indicators reflect widespread ambivalence across multiple metrics:
- The Relative Strength Index (RSI) holds steady near neutral territory at 46;
- The Stochastic Oscillator reads around 53—also indicating no clear directional bias;
- The Commodity Channel Index (CCI) rests modestly negative at −40;
- The Average Directional Index (ADX), measuring trend strength sits low at just 18—suggesting weak trend presence;
- Meanwhile,the Moving Average Convergence Divergence (MACD) registers −1, 019 hinting faint bullish signals alongside momentum oscillator values sitting negative too (−328).
A look into moving averages tells another story—short-term exponential moving averages (EMA) and simple moving averages (SMA) based on ten periods suggest some upward pressure since they hover just above current prices ($87, 733 &$87, 741 respectively). However,longer-term averages spanning twenty up through two hundred periods tilt downward significantly ranging from roughly $88, 050 all way up past $107, 094 signaling prevailing bearish tendencies still weigh heavily on this market’s psyche following previous volatility swings.
Bullish Perspective:
If bitcoin manages solid breakout beyond resistance zone lying between ~$88, 200–89, 200 accompanied by meaningful uptick in trade volumes,it could pave way toward short-term gains targeting areas closer toward ~$91&comma000–93&comma000. The ten-period moving averages provide initial cushion supporting such advances,and positive shifts noted within MACD along with other momentum gauges may fuel renewed buying interest. Nonetheless until volumes rise decisively,bulls should maintain cautious optimism rather than aggressive bets.
Bearish Outlook:
Given longer-dated moving average trends casting shadows over present price moves coupled with lackluster participation during attempted rallies,bears appear poised atop current ranges.Breakdown failure beneath key psychological threshold (~&$88000)&if followed by drop below ~&$86500 might open doorways toward downside targets nearer ~&$84000.As things stand,the repeated formation lower highs continues reinforcing bearish technical DNA embedded within broader structure.
Frequently Asked Questions
What’s Bitcoin’s current trading band?
Bitcoin trades narrowly inside €$87,831–€$88,067, according December 20, 20, 2’s data.
Is Bitcoin leaning bullish or bearish?
Mixed signals dominate technicals showing mild bullish attempts overshadowed by overarching bearish patterns visible especially across longer durations.
Where are critical support/resistance points?
Support lies close approx €$;86,5;#44 while resistances cluster amid €$;88,#48;-€$;8#57,#50#48 zones.
What are Bitcoin’s latest market cap →tading volume stats?
Market cap stands nearly €1&period75 trillion whilst daily turnover hits about €35&period5 billion.