
Bitcoin has recently weathered a significant sell-off and found stability at crucial support levels, indicating that buyers are firmly in control. With the market maintaining its structure, insights from Quantum Models suggest that Wave (3) is currently in progress, with a near-term target projected around $104,000.
The Q-Structure Confluence Remains Strong, Sustaining Bullish Sentiment
A recent update from Elliott Chart pointed out that Bitcoin is well-supported within the Q-Structure λ₅ confluence zone. This level continues to bolster an overall bullish perspective. The support area has effectively absorbed selling pressure, implying that larger players are still defending critical levels despite recent fluctuations.
Upon further analysis of the market structure, it appears that the latest pullback is being classified as a complex corrective phase rather than signaling the start of a broader downtrend. Specifically, this correction is viewed as Intermediate Wave (2), unfolding through a Zigzag W | Zigzag X | Triangle Y formation.
With this corrective pattern largely resolved now, Elliott Chart indicates that Intermediate Wave (3) is underway; Minor Waves 1 and 2 have already begun to form. This development suggests that the market is laying down groundwork for a more decisive upward movement.
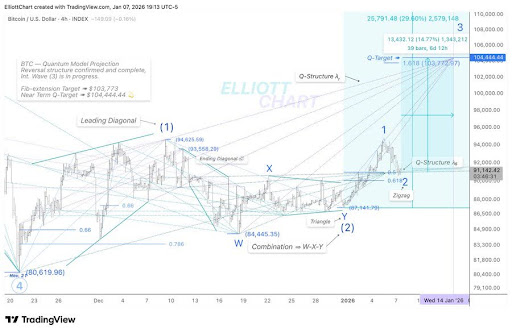
The key component still evolving is an impulsive Minor Wave 3. Historically speaking, this wave tends to be both powerful and aggressive during advances. If it unfolds as anticipated, projections indicate a near-term Q-Target around $104,444 based on the Q-Structure λᵣ projection.
This optimistic scenario arises from insights derived within Quantum Models’ framework and does not rely on short-term fluctuations. Notably, this potential trend reversal was first identified back on November 15 during Bitcoin’s decline.
Sharp Decline Meets Robust Demand at Key Levels
Diving into current price movements reveals that Bitcoin underwent a sharp decline but found buyers right at essential support levels—allowing prices to stabilize and gradually rise again. This reaction signifies strong demand absorbing recent sell-offs rather than panic selling taking over; thus reflecting healthy participation from buyers at pivotal zones.
This type of price action illustrates absorption rather than fear-driven behavior. What stands out most prominently is the emergence of higher-low structures following the drop—a crucial indicator suggesting weakening downside pressure. As long as Bitcoin remains within this reclaimed range, risks associated with deeper sell-offs decrease while preserving opportunities for further upward momentum.
Sideways or consolidating price actions at these levels bode well for the overall cryptocurrency market landscape—sustaining such structures paves way for healthier advancements in Bitcoin instead of erratic or volatile rebounds.
Featured image from Pixabay; chart sourced from Tradingview.com