The price of Bitcoin is currently consolidating within a narrowing triangular pattern, indicating an imminent critical juncture as converging support and resistance levels suggest that a surge in volatility is on the horizon.
Summary
– The tightening triangle formation points to an upcoming breakout and increased volatility.
– Rising lows hint at strengthening demand, favoring a bullish outcome.
– The $76,700 resistance level becomes the primary target if a breakout is confirmed with solid volume.
Bitcoin (BTC) has entered a phase of constructive consolidation, shaping a distinct triangle pattern that reflects growing equilibrium between buyers and sellers. Following recent fluctuations, price action has compressed significantly as dynamic support and resistance lines draw closer together. Such compression often precedes substantial directional moves since markets rarely stay confined for long periods.
Triangle patterns typically represent market indecision before one side gains control leading to breakout momentum. Currently, Bitcoin remains inside this triangular structure without confirming any decisive move yet. However, as the price nears the apex of this formation, the likelihood of an expansion in volatility rises sharply.
The market stands at a pivotal crossroads where renewed momentum will likely dictate Bitcoin’s forthcoming trend direction.
Key Technical Highlights for Bitcoin Price
- Bitcoin trades within a well-defined triangle pattern signaling consolidation;
- The approach toward the apex heightens chances for an imminent breakout;
- If bullish momentum prevails with volume confirmation, $76,700 resistance becomes the next major upside target.
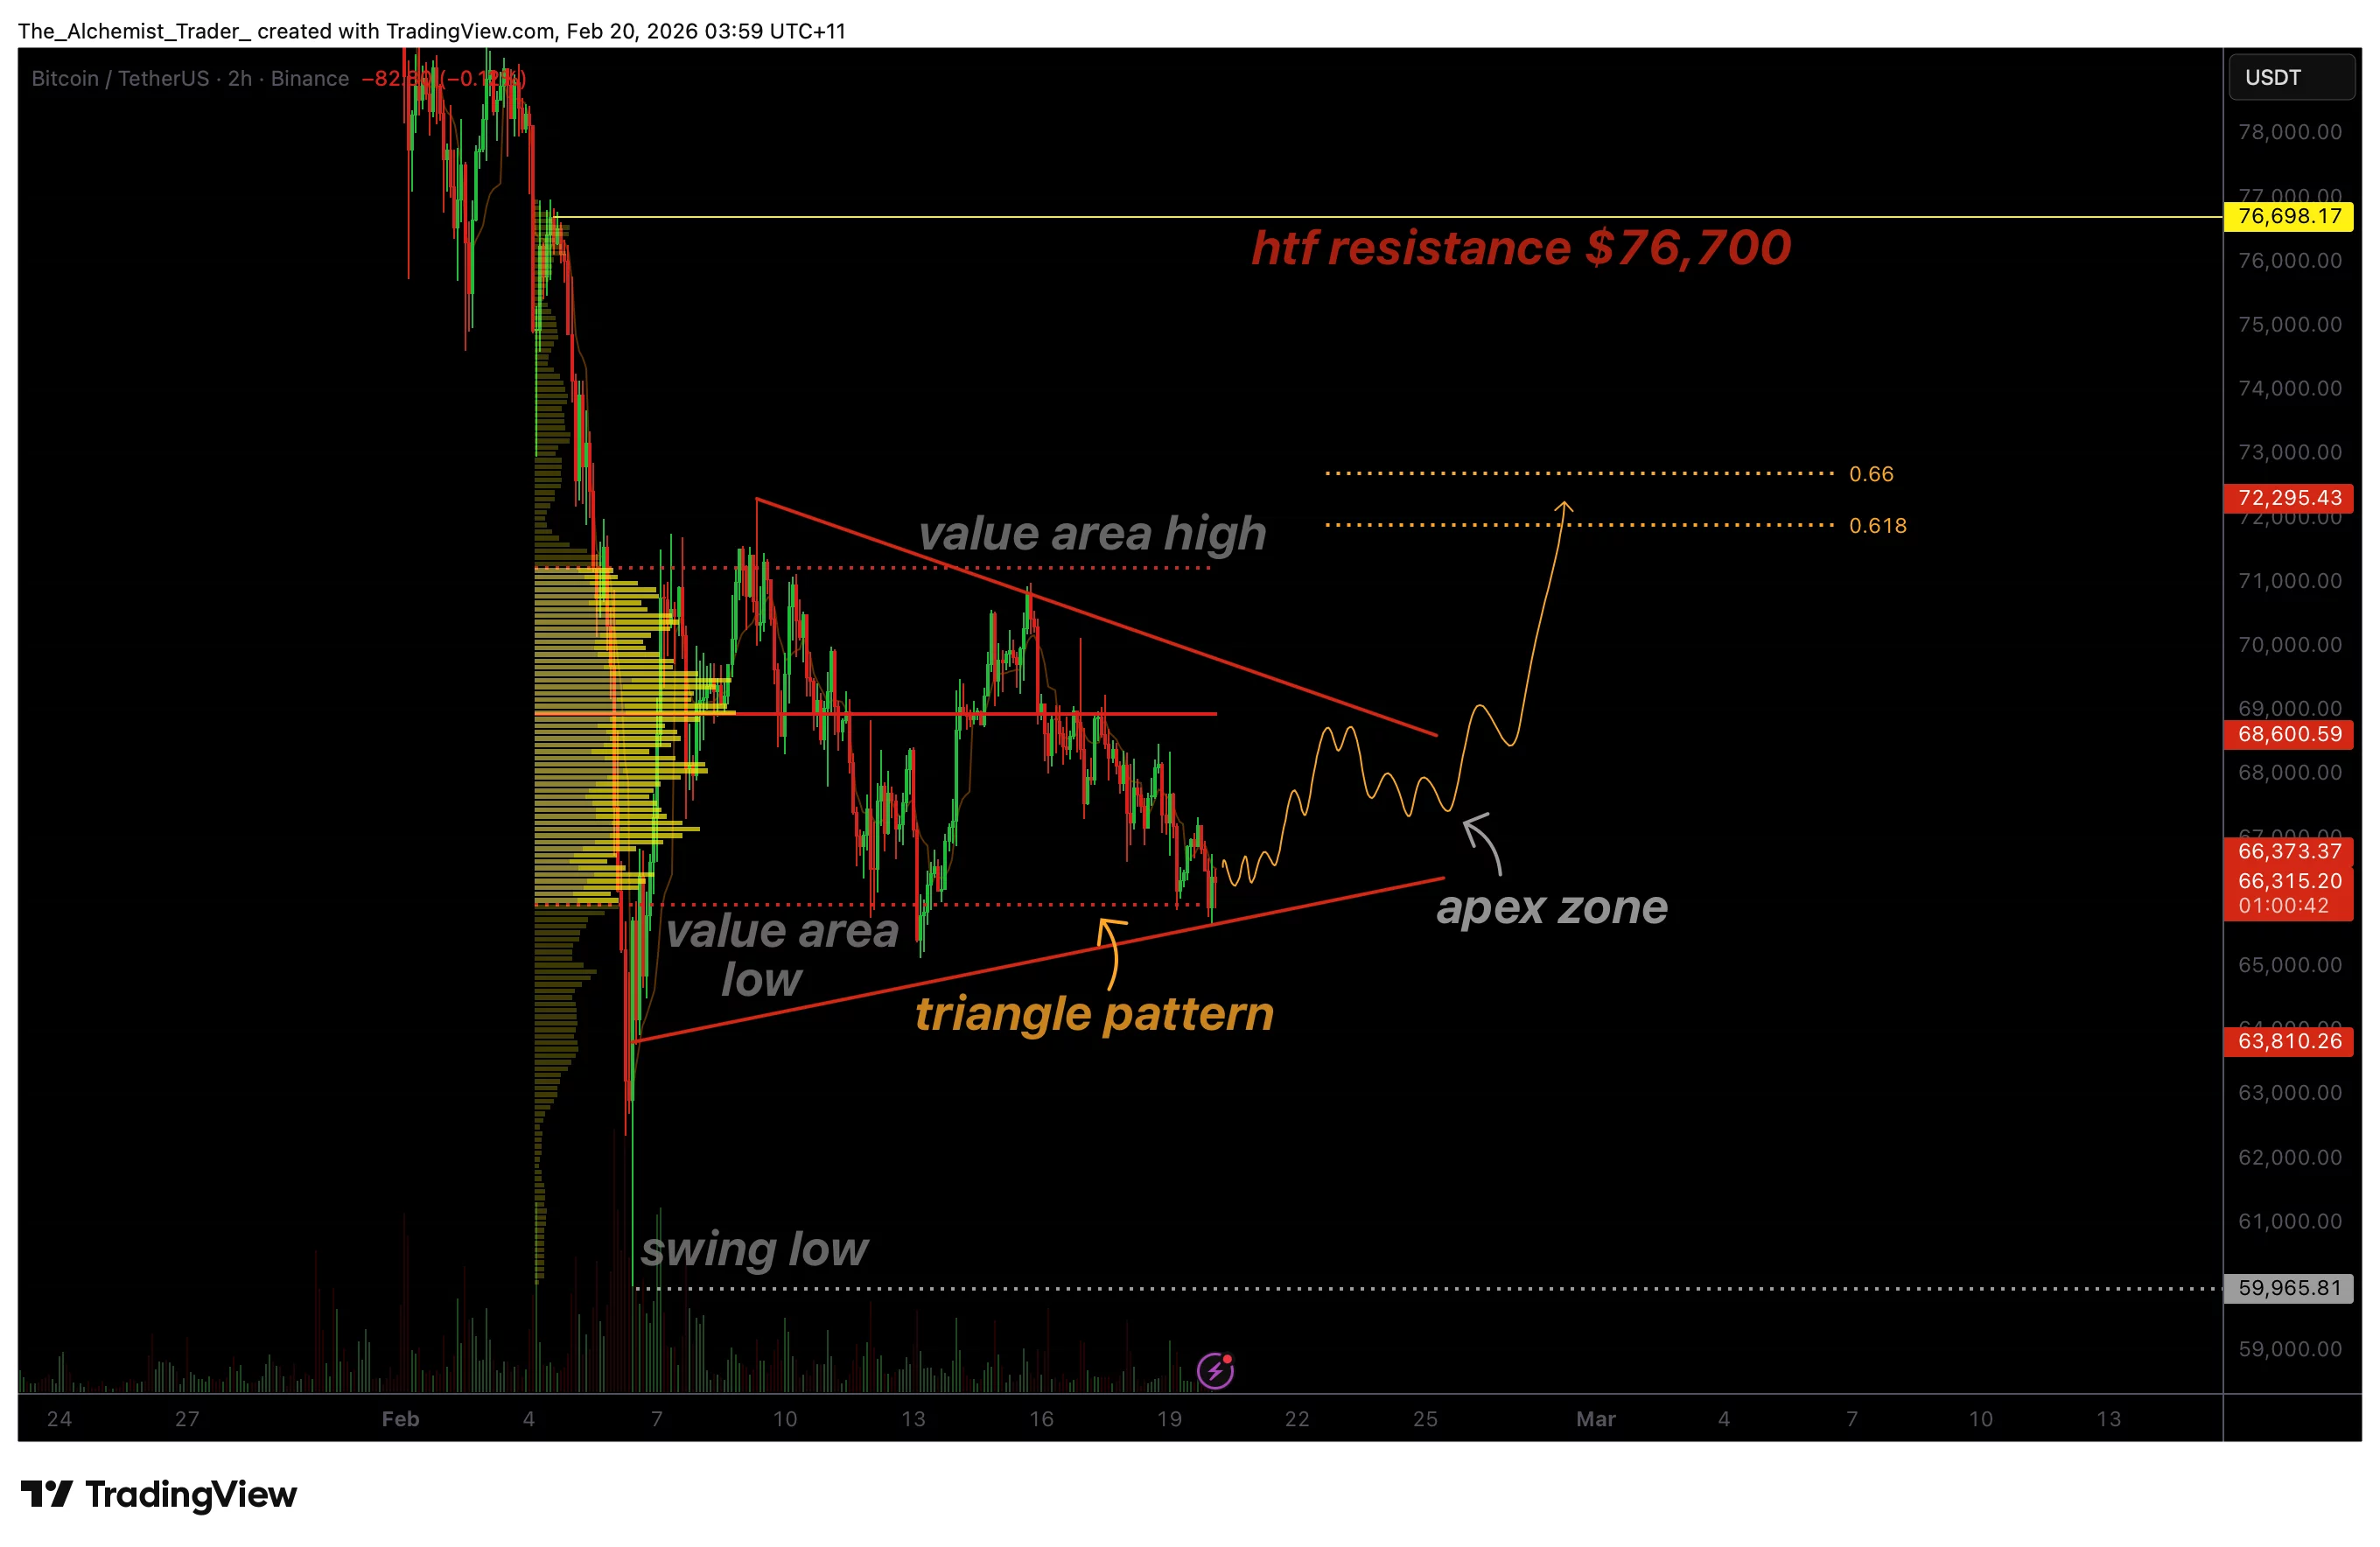
This current triangular setup features converging dynamic support and resistance closely aligned with key value area boundaries. Each bounce off support combined with rejection from resistance progressively tightens trading ranges while diminishing volatility — classic signs of forming an apex structure.
This scenario indicates neither buyers nor sellers dominate presently; instead liquidity accumulates on both sides awaiting clear directional cues. As compression intensifies even slight shifts can trigger rapid expansions once prices break free from this range-bound state.
It’s important to note that no confirmed breakout has occurred yet; until then Bitcoin remains in consolidation rather than trending decisively upward or downward.
Higher Lows Indicate Building Positive Momentum
A significant observation within this triangle is that higher lows are emerging near key value areas — signaling buyers are stepping in earlier during pullbacks which gradually pushes prices upward over time.
This pattern doesn’t guarantee bullish outcomes but strongly suggests constructive demand underlying current consolidations. Markets exhibiting rising lows amid sideways movement tend to resolve upwards especially when supports hold firm consistently over multiple tests.
This behavior resembles accumulation phases rather than distribution ones—bolstering prospects for bullish continuation once the triangle resolves itself conclusively.
Apex Zone: The Crucial Decision Point
The apex represents where these converging trendlines meet—the most critical zone forcing market participants into making directional choices soon due to limited room left for further compression within this shape.
Breakouts commonly happen near or just beyond this point because prolonged sideways movement becomes unsustainable here.
However simply breaking out isn’t enough: volume confirmation plays vital role ensuring genuine participation returns alongside strong conviction behind moves.
Without accompanying increases in trade volumes breakouts risk failing quickly resulting in false signals followed by reversals back inside previous ranges.
Upside Target Set At $76 , 700 Resistance Level
Should Bitcoin manage an upside breach supported by robust volume growth attention turns toward overcoming high-timeframe supply around $ 76 , 700 .
This mark stands as significant technical barrier reflecting prior selling pressure zones embedded deep within broader chart structures .
A successful push above would mark conclusion of current stagnation phase triggering fresh rally legs potentially attracting new traders chasing momentum alongside renewed market enthusiasm .
What Lies Ahead For Price Action ?
Technically speaking , bitcoin approaches macro-level decision threshold characterized by pronounced compression visible through its tightening triangular form . Compression almost invariably precedes expansion phases heralding heightened activity ahead .
In short term traders should brace themselves anticipating elevated swings especially around approaching apex area where tension peaks awaiting resolution via confirmed breakouts backed by rising volumes .
While higher lows lean towards positive resolution ultimate validation depends upon actual confirmation : until then bitcoin stays locked inside consolidation albeit poised readying itself rapidly before major move unfolds fully .
Upcoming sessions promise defining moments shaping bitcoin ’ s next sustained trend direction amidst expected surge expanding overall market volatility dramatically .
Read more: Phemex launches AI-native revolution signifying full-scale AI transformation.