
On Thursday, U.S. markets experienced a slight decline as a significant downturn in the cryptocurrency sector affected software and commodity stocks. Bitcoin fell by 9%, reaching approximately $66,000—its lowest point since October 2024.
Summary
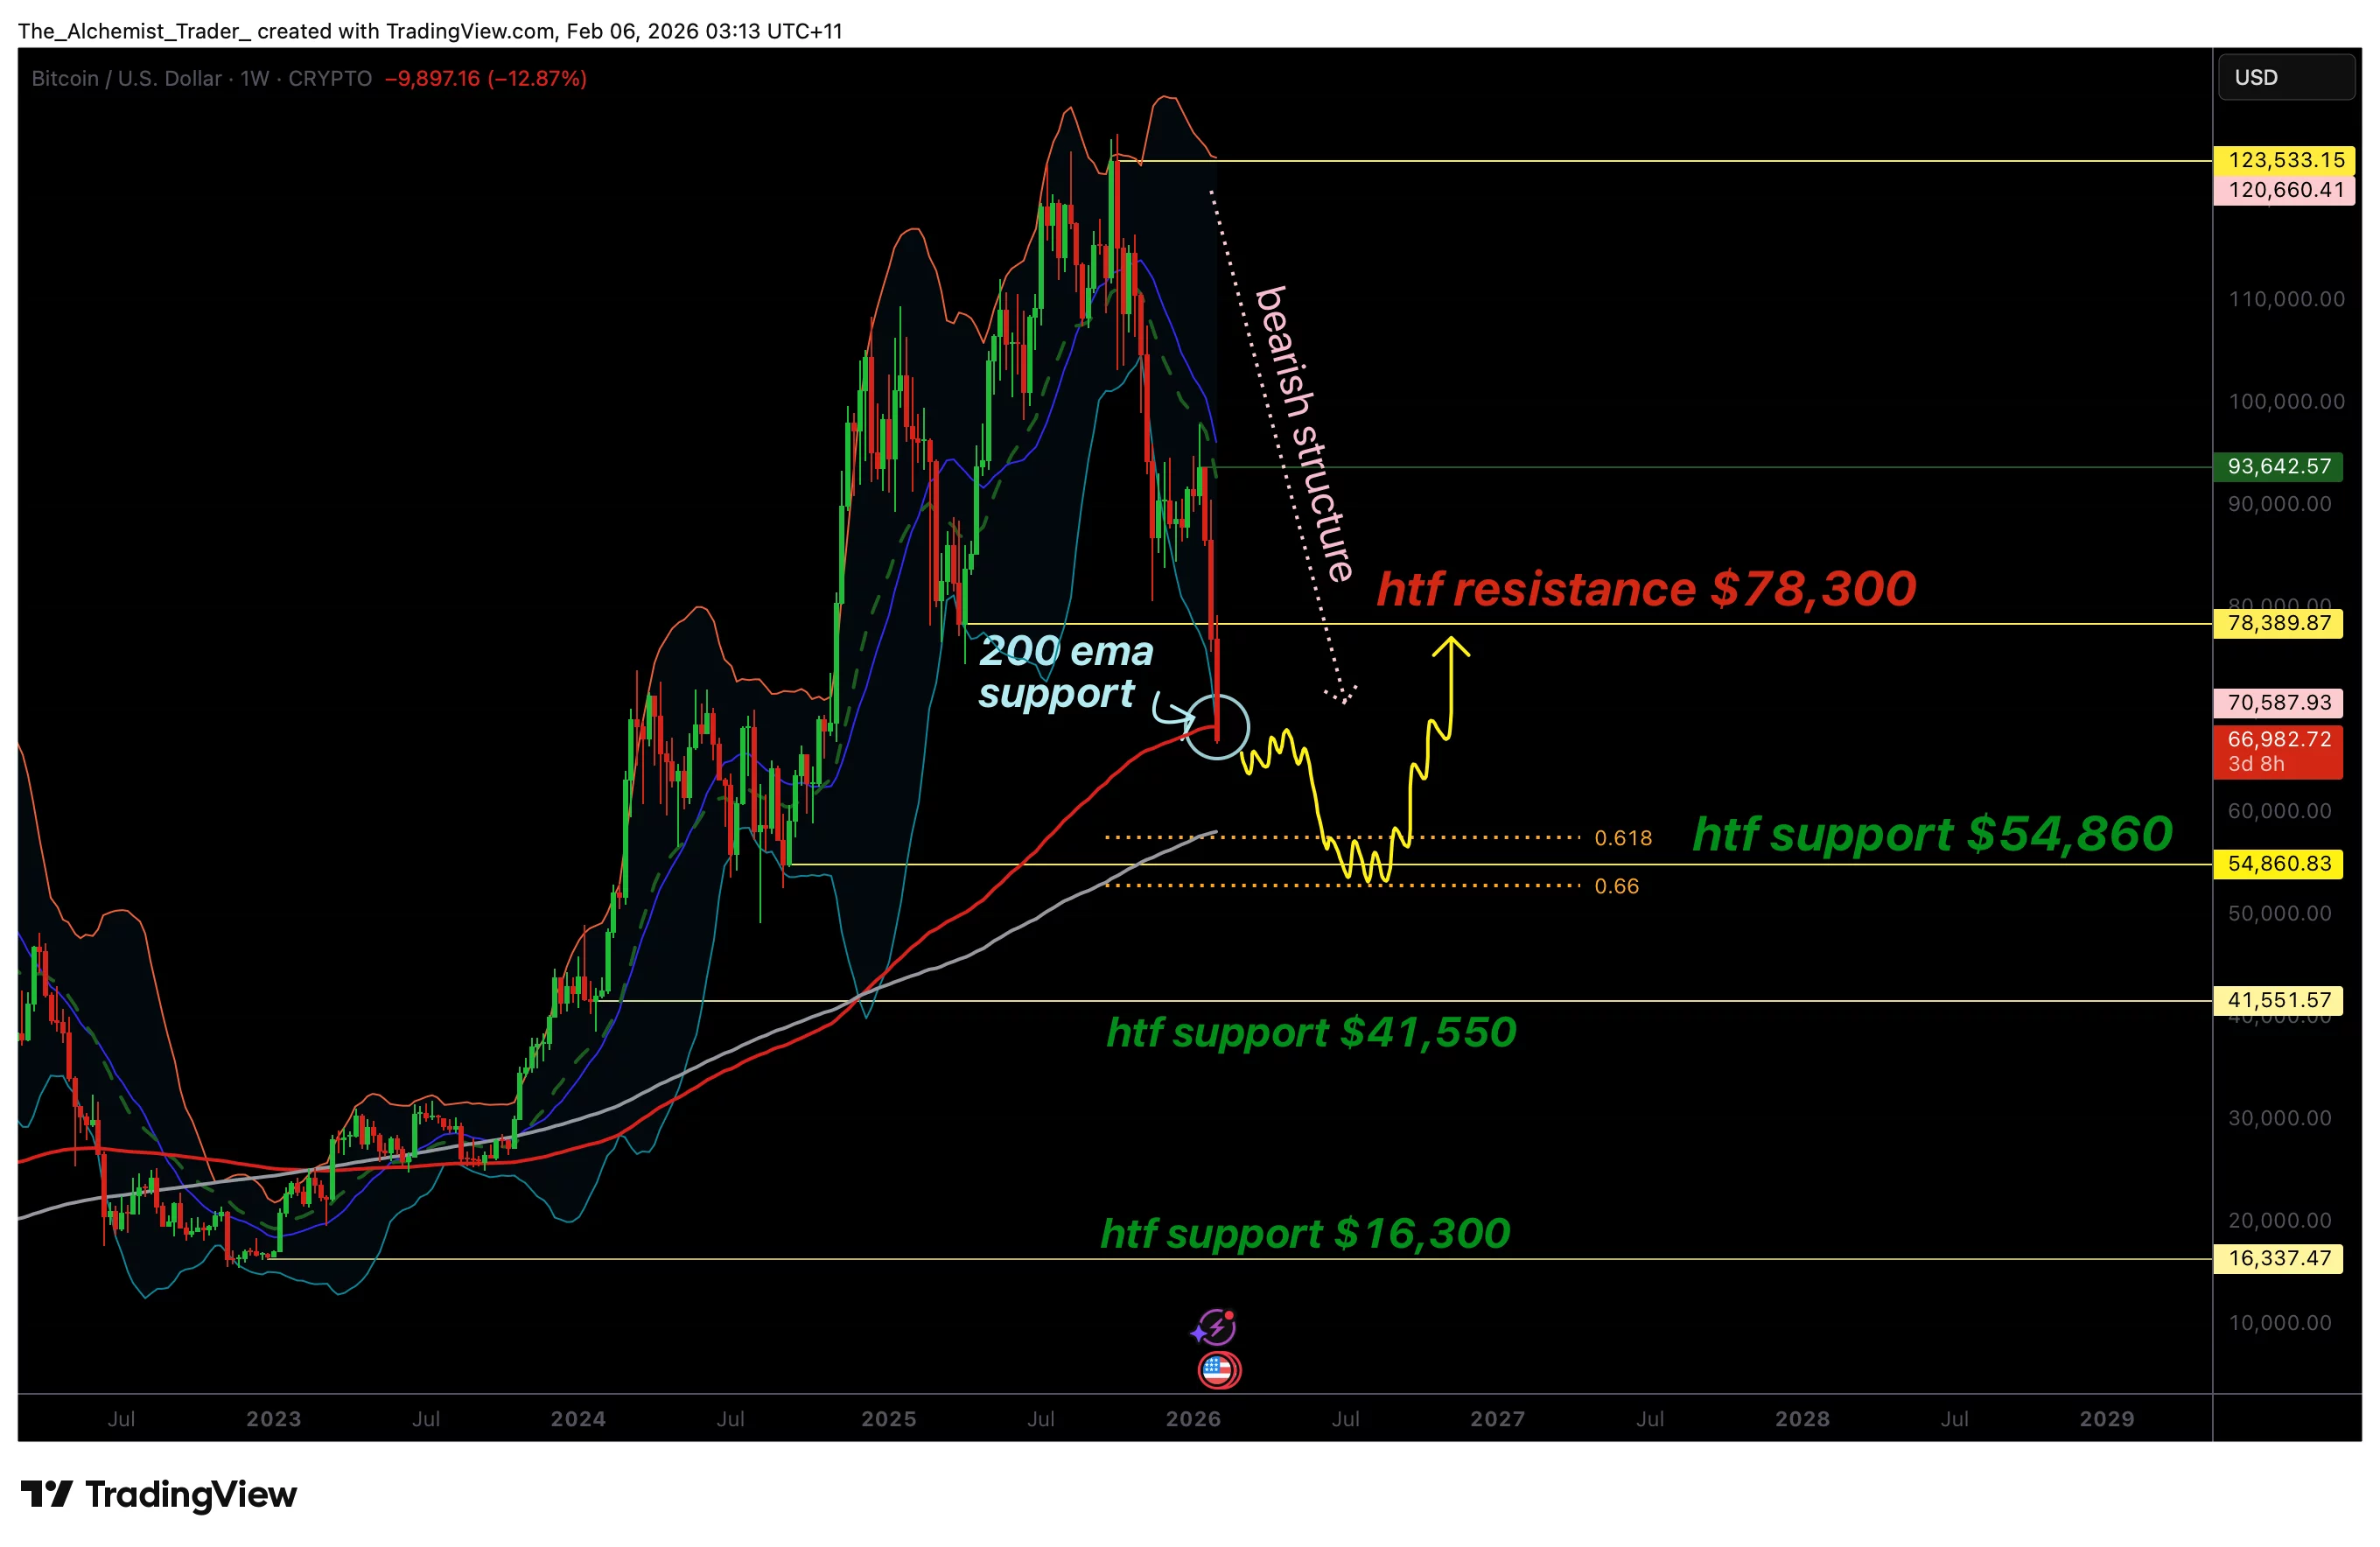
The weakening of the 21-week EMA indicates a loss of bullish trend structure.
The critical long-term support level at the 200-week EMA is currently being tested.
The $60,000–$54,000 range is crucial due to converging Fibonacci levels and daily support.
Stocks tied to cryptocurrencies were among the biggest losers; companies like Strategy, Mara Holdings, and CleanSpark saw declines of around 12%. Silver prices dropped by 13%, while gold fell by 2% amid widespread risk aversion.
The Nasdaq 100 index was on track for its third consecutive day of losses as investors grappled with ongoing selling pressure in Bitcoin ($BTC). This situation has raised concerns about potential deeper corrections toward the $60,000 mark as key long-term technical supports are being tested.
Over recent weeks, Bitcoin’s price movements have clearly entered a corrective phase characterized by increasing bearish momentum across longer timeframes.
After failing to maintain upward momentum, $BTC has shifted downward and is now approaching an essential cluster of long-term technical support levels.
A significant point to note is that prices are nearing major weekly EMA support. This places the market at a critical juncture where future directional movement will likely be determined.
Historically speaking, Bitcoin has reacted strongly when it reaches this area; however, current market conditions suggest that downside risks remain high.
If key moving average supports fail on closing terms, there’s an increased likelihood of capitulation-style moves that could push prices below the psychological threshold of $60,000.
Main Technical Aspects for Bitcoin Pricing
- The weakening trend indicated by the 21-week EMA suggests diminishing bullish trend support;
- The testing phase for the crucial long-term structural defense represented by the 200-week EMA;
- A confluence zone between $60k-$54k holds significance due to Fibonacci retracement levels and daily supports aligning together;
An analysis from higher timeframes reveals that Bitcoin’s structure has shifted decisively into bearish territory. The formation of consecutive lower highs alongside expanding downside candles illustrates aggressive selling activity while buyers struggle to regain dominance over market dynamics.
The breach below the critical level represented by the 21-week EMA typically signifies a transition from bullish trends into more profound corrective phases—a pattern echoed in current pricing behavior.
Presently trading near its historical low at around $27K concerning this particular moving average emphasizes its importance within broader market cycles. A sustained drop beneath this threshold would indicate continued bearish momentum seeking lower valuations ahead.
$60K Support Faces Growing Pressure
As downward pressures persist on pricing actions observed lately,$60000 emerges prominently both psychologically & technically within trading contexts.
A breakdown past this pivotal area could trigger heightened negative momentum especially if confirmed through subsequent losses seen via EMAs across weekly intervals.
Attention would then shift towards regions surrounding$57000 followed closely thereafterby deeper convergence zones near$54000 aligning closely with0.618Fibonacci retracement points alongside vital daily supportive structures creating high-probability targets should existingEMA protections falter!
You might also like: Crypto market crashes as top economist predicts cryptocurrency apocalypse
Persistent Bearish Structure Heightens Capitulation Risks
A defining feature characterizing today’s marketplace lies firmly rooted within strength & persistence associated with ongoingbearish tendencies!
Unlike shallow pullbacks witnessed during robust uptrends,this correction unfolds rapidly reflecting forced sell-offs rather than healthy consolidations occurring naturally!
Historically speaking aggressive bear structures often culminate through capitulations once substantial supporting thresholds fall away altogether!
In regards specificallytoBitcoin,a weekly close dropping beneath200weekEMA may incite panic-driven sell-offs flushing remaining weak hands out from active participation entirely!While such movements tend towards violence they frequently precede meaningful local bottoms emerging subsequently thereafter!
Your Expectations Regarding Future Price Movements
Evidently viewed through lenses encompassing technical analysis combinedwithprice-action observations& overall structural assessments reveal Bitcoins positioning remains pivotal right now.The presentEMAsupportzone represents an essential boundary line drawn clearly favoring bulls.Holding above these parameters might enable stabilization coupledwithpotential corrective rebounds although any recovery efforts shall remain vulnerable unless previously established resistances get reclaimed effectively afterwards too!
<PConversely failure holding ontoweeklyEMA-support significantly heightens probabilities associated w/capitulative movements targeting ranges spanningbetween$60000-$54000.Traders ought carefully monitor upcomingweekly closes&volume behaviors confirming developments taking place until bullish frameworks return ultimately ensuring downside risks continue prevailing alongwithexpected volatility persisting throughout forthcoming sessions ahead too!
Read more: Ethereum’s role is changing alongwith how investors perceive income generation strategies