Bitcoin is currently trading within a narrow band close to $90,000, following a three-day period of ETF outflows.
This phase of market consolidation resembles patterns observed before the anticipated surge in 2025, characterized by low volatility.
Key price levels to keep an eye on include support at $90K and immediate resistance at $95K, with a breakout target set at $100K.
The price of Bitcoin (BTC) has been hovering around the $90,000 mark for some time now.
This cryptocurrency appears to be consolidating after experiencing significant fluctuations at the beginning of 2026.
The movements in Bitcoin’s price are heavily influenced by ETF flows and ongoing macroeconomic uncertainties.
Impact of Bitcoin ETF Outflows on BTC Price
At the start of January, there was notable interest in Bitcoin spot ETFs as they attracted substantial inflows from institutional investors.
However, a consecutive three-day outflow exceeding $1 billion has nearly negated those initial gains.
This trend suggests that institutional confidence may be diminishing.
The recent outflows have hindered Bitcoin’s ability to surpass the $95,000 threshold.
Cautious sentiment prevails among traders due to geopolitical tensions involving the USA and various Latin American nations alongside Iran, contributing to an overall risk-averse atmosphere in the market.
The current redemption trends for ETFs are significantly influencing short-term price actions.
These flows might indicate tactical shifts rather than long-term sell-offs.
Investors could be reallocating their investments into different assets while still keeping exposure to Bitcoin.
This short-term pressure has resulted in BTC trading within a confined range between approximately $88,000 and $95,000.
Resemblance to Pre-2025 Rally Patterns
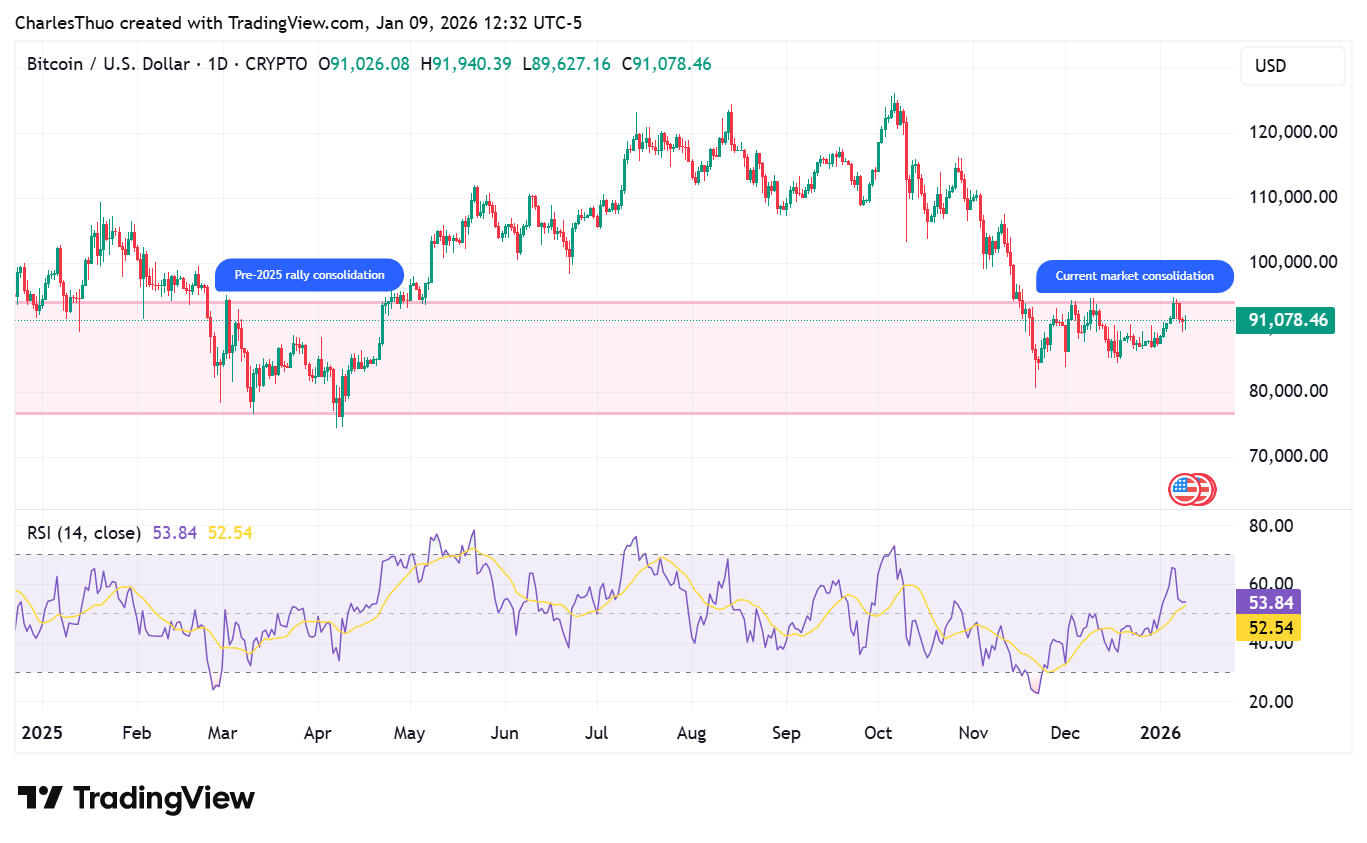
Current consolidation mirrors pre-2025 rally consolidation | Source: TradingView
.
The current sideways movement seen with Bitcoin closely resembles its behavior prior to its rally back in 2025.
In those months leading up to that surge , BTC remained within a narrow range for almost fifty days , which is often referred to as time-based capitulation .
This phase allowed weaker hands in the market an opportunity exit , paving way for strong upward momentum .
The present state of market consolidation reflects this pattern , hinting that it may quietly gather strength .
& nbsp;
The current sideways movement seen with Bitcoin closely resembles its behavior prior to its rally back in 2025.
In those months leading up tothe surge,BTC remainedwithin anarrowrangeforalmostfiftydays,
which isoftenreferredtoastime-basedcapitulation.
Thisphaseallowedweakerhandsinthemarketanopportunityexit,pavingwayforstrongupwardmomentum.
Thepresentstateofmarketconsolidationreflectsthispattern,hintingthatitmightquietlygatherstrength.
Unlike traditional capitulation phases marked by panic selling or sharp declines,
this period is defined by low volatility and stable ranges typical during accumulation before rallies.
Some analysts interpret this situation as potential preparation for significant breakouts ahead.
The pressures from ETF outflows along with geopolitical factors might just represent temporary hurdles.
If historical trends hold true,a sustained move above key resistance levels could ignite renewed bullish activity.
Main Price Levels for Monitoring
One crucial level worth observing remains near$90k actingas strongsupport.Abreakbelowthislevelcouldleadtoadditionaldeclines towards$86k-$88k.Oncontrary,aconsistentmoveabove$95kwouldindicateincreasedinstitutionalinterestandpotentialacceleration.Inaddition,surpassingthe$100kmarkmightbringthemarketbacktowardmid-2025peaksandpossiblytarget$110kin themediumterm.As we proceed forward,both tradersandinvestors shouldstayvigilantregardingtechnicallevelsalongside macroeconomic catalysts astheyassesswhenandhowsignificantthenextsurgewilloccur.