Bitcoin has been exhibiting quite a volatile temperament recently—oscillating, rebounding, and keeping analysts on edge with every candlestick movement. As of Thursday morning around 8:30 a.m. EST, the cryptocurrency giant is lingering just under $88,000, caught in a tug-of-war between hesitant bears unwilling to relinquish control and bulls cautiously rallying their strength.
Bitcoin’s Technical Outlook
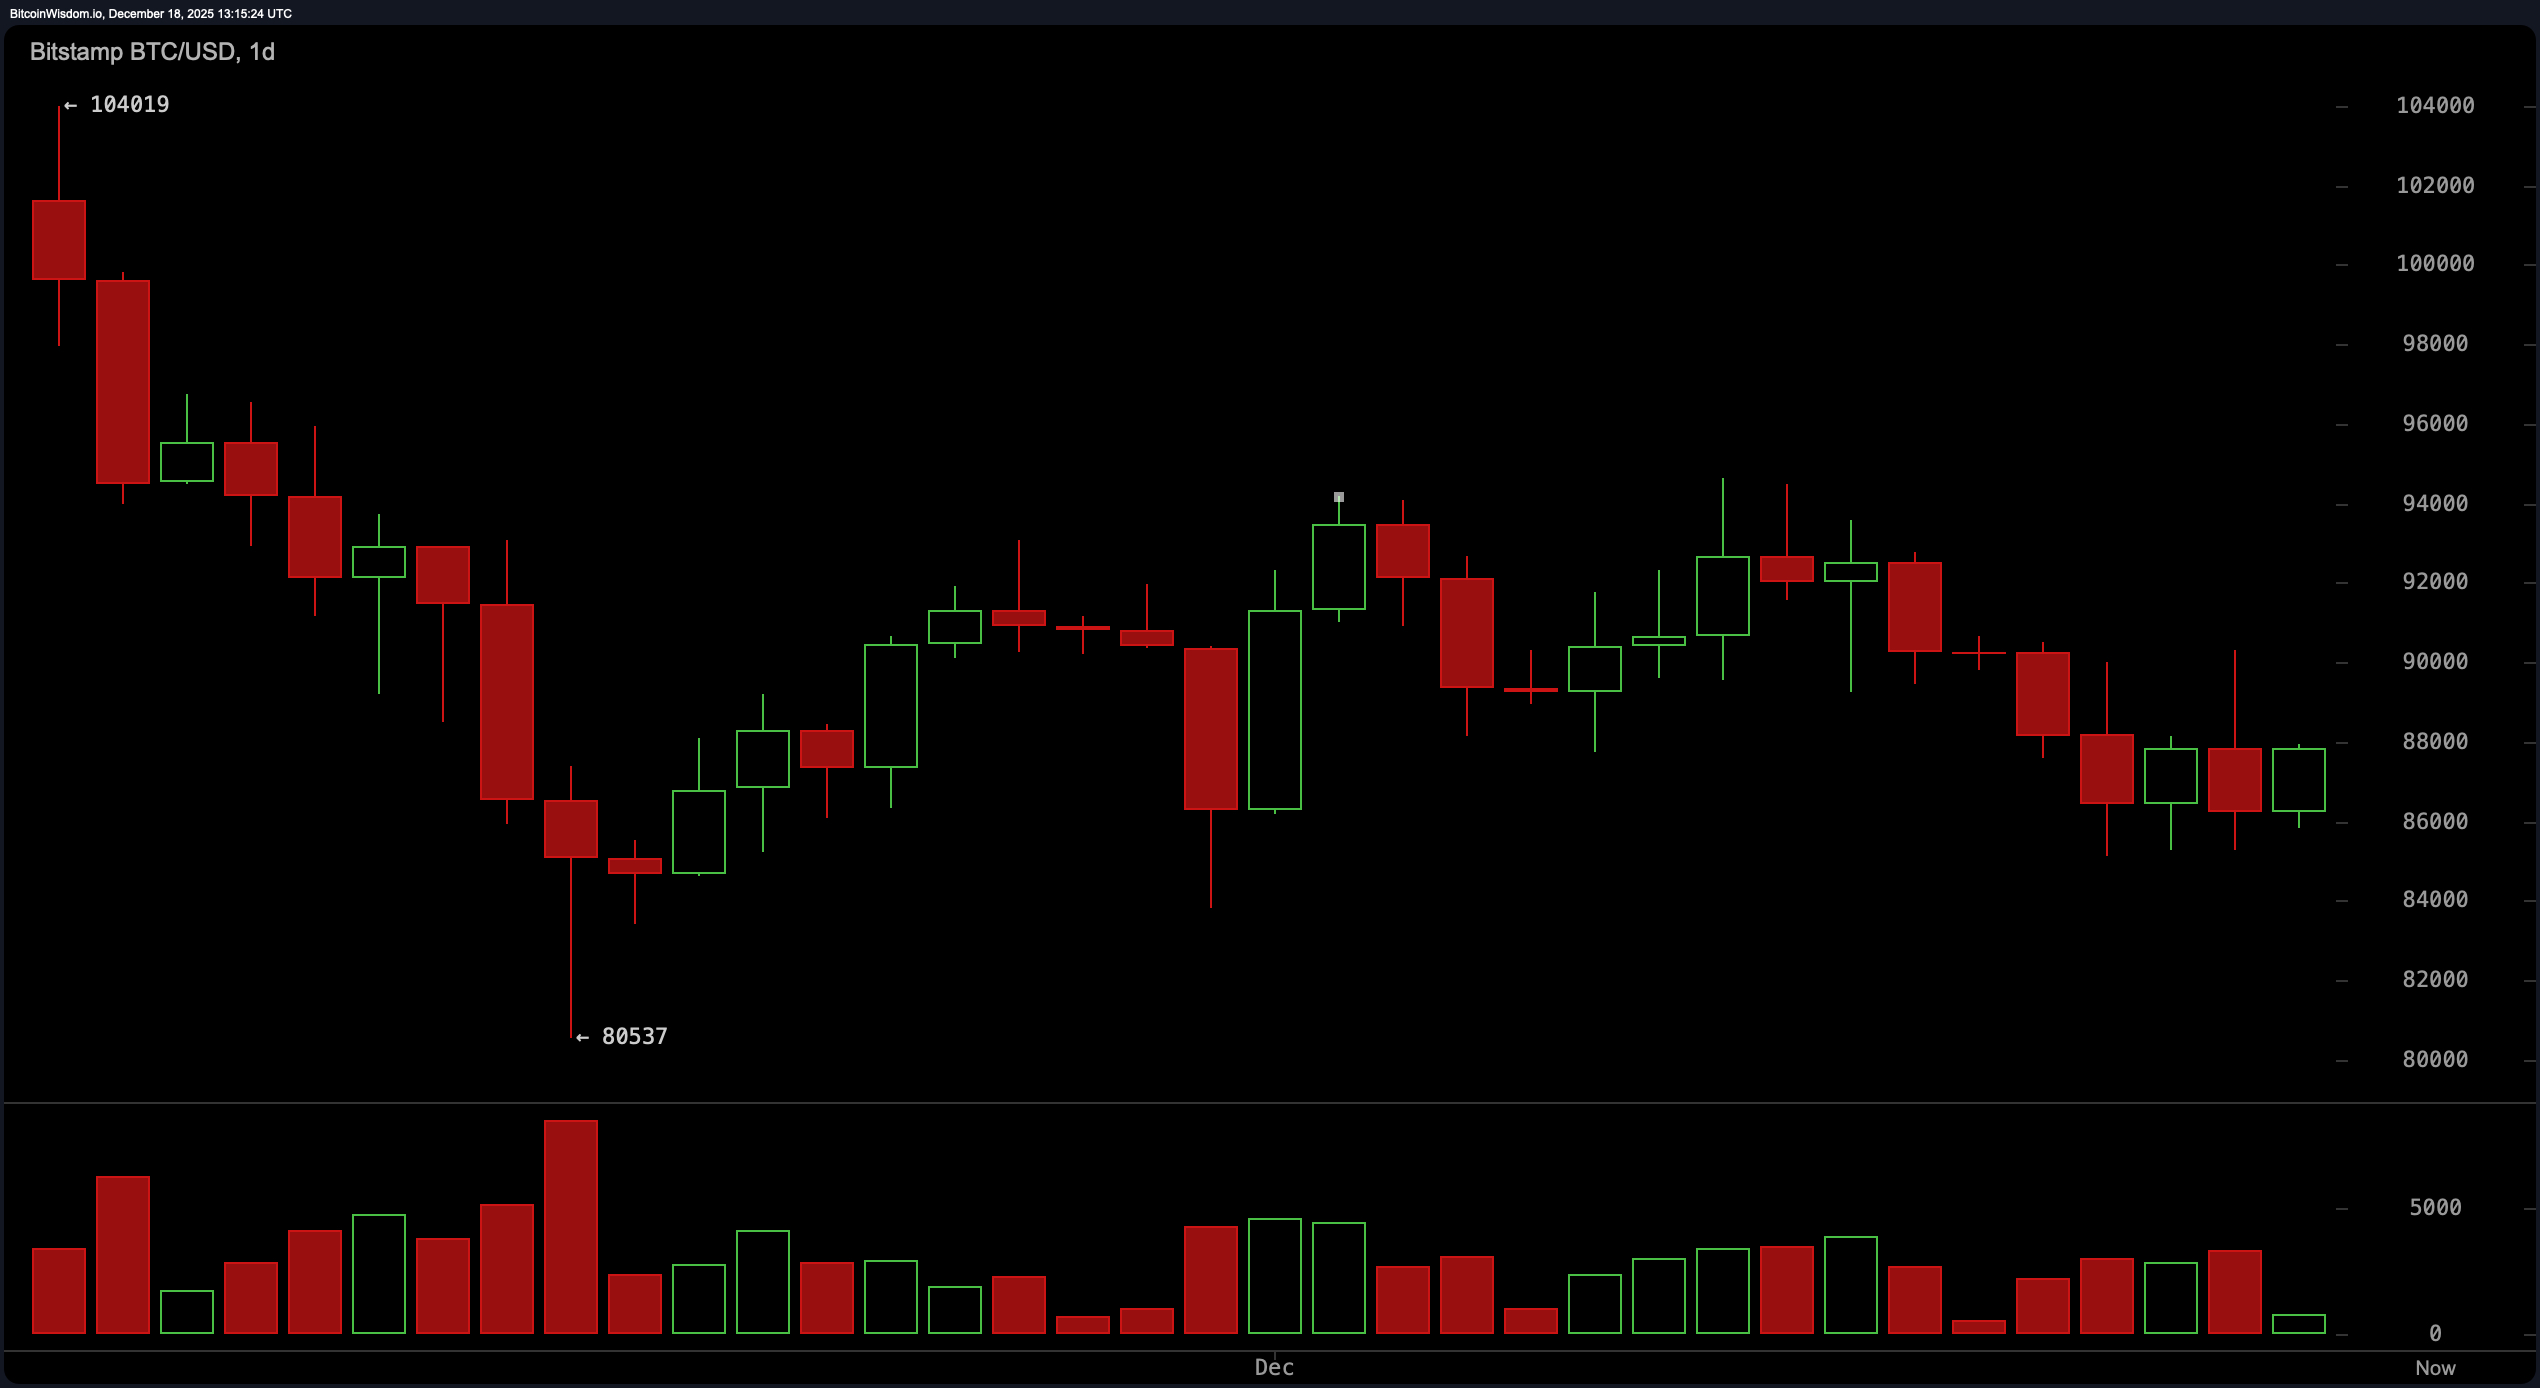
The Relative Strength Index (RSI) on the daily chart rests at 41, indicating a neutral stance that mirrors the market’s indecisiveness. Meanwhile, the Moving Average Convergence Divergence (MACD) presents a pessimistic tone with its negative value of −1,799, signaling potential downward pressure.
On the other hand, momentum indicators such as Momentum (10) and Commodity Channel Index (CCI 20) are subtly hinting at bullish tendencies. Coupled with an Average Directional Index (ADX 14) reading of 26—which confirms neither strong trend nor complete stagnation—the market appears conflicted: lacking enough conviction to surge yet not broken enough to collapse.
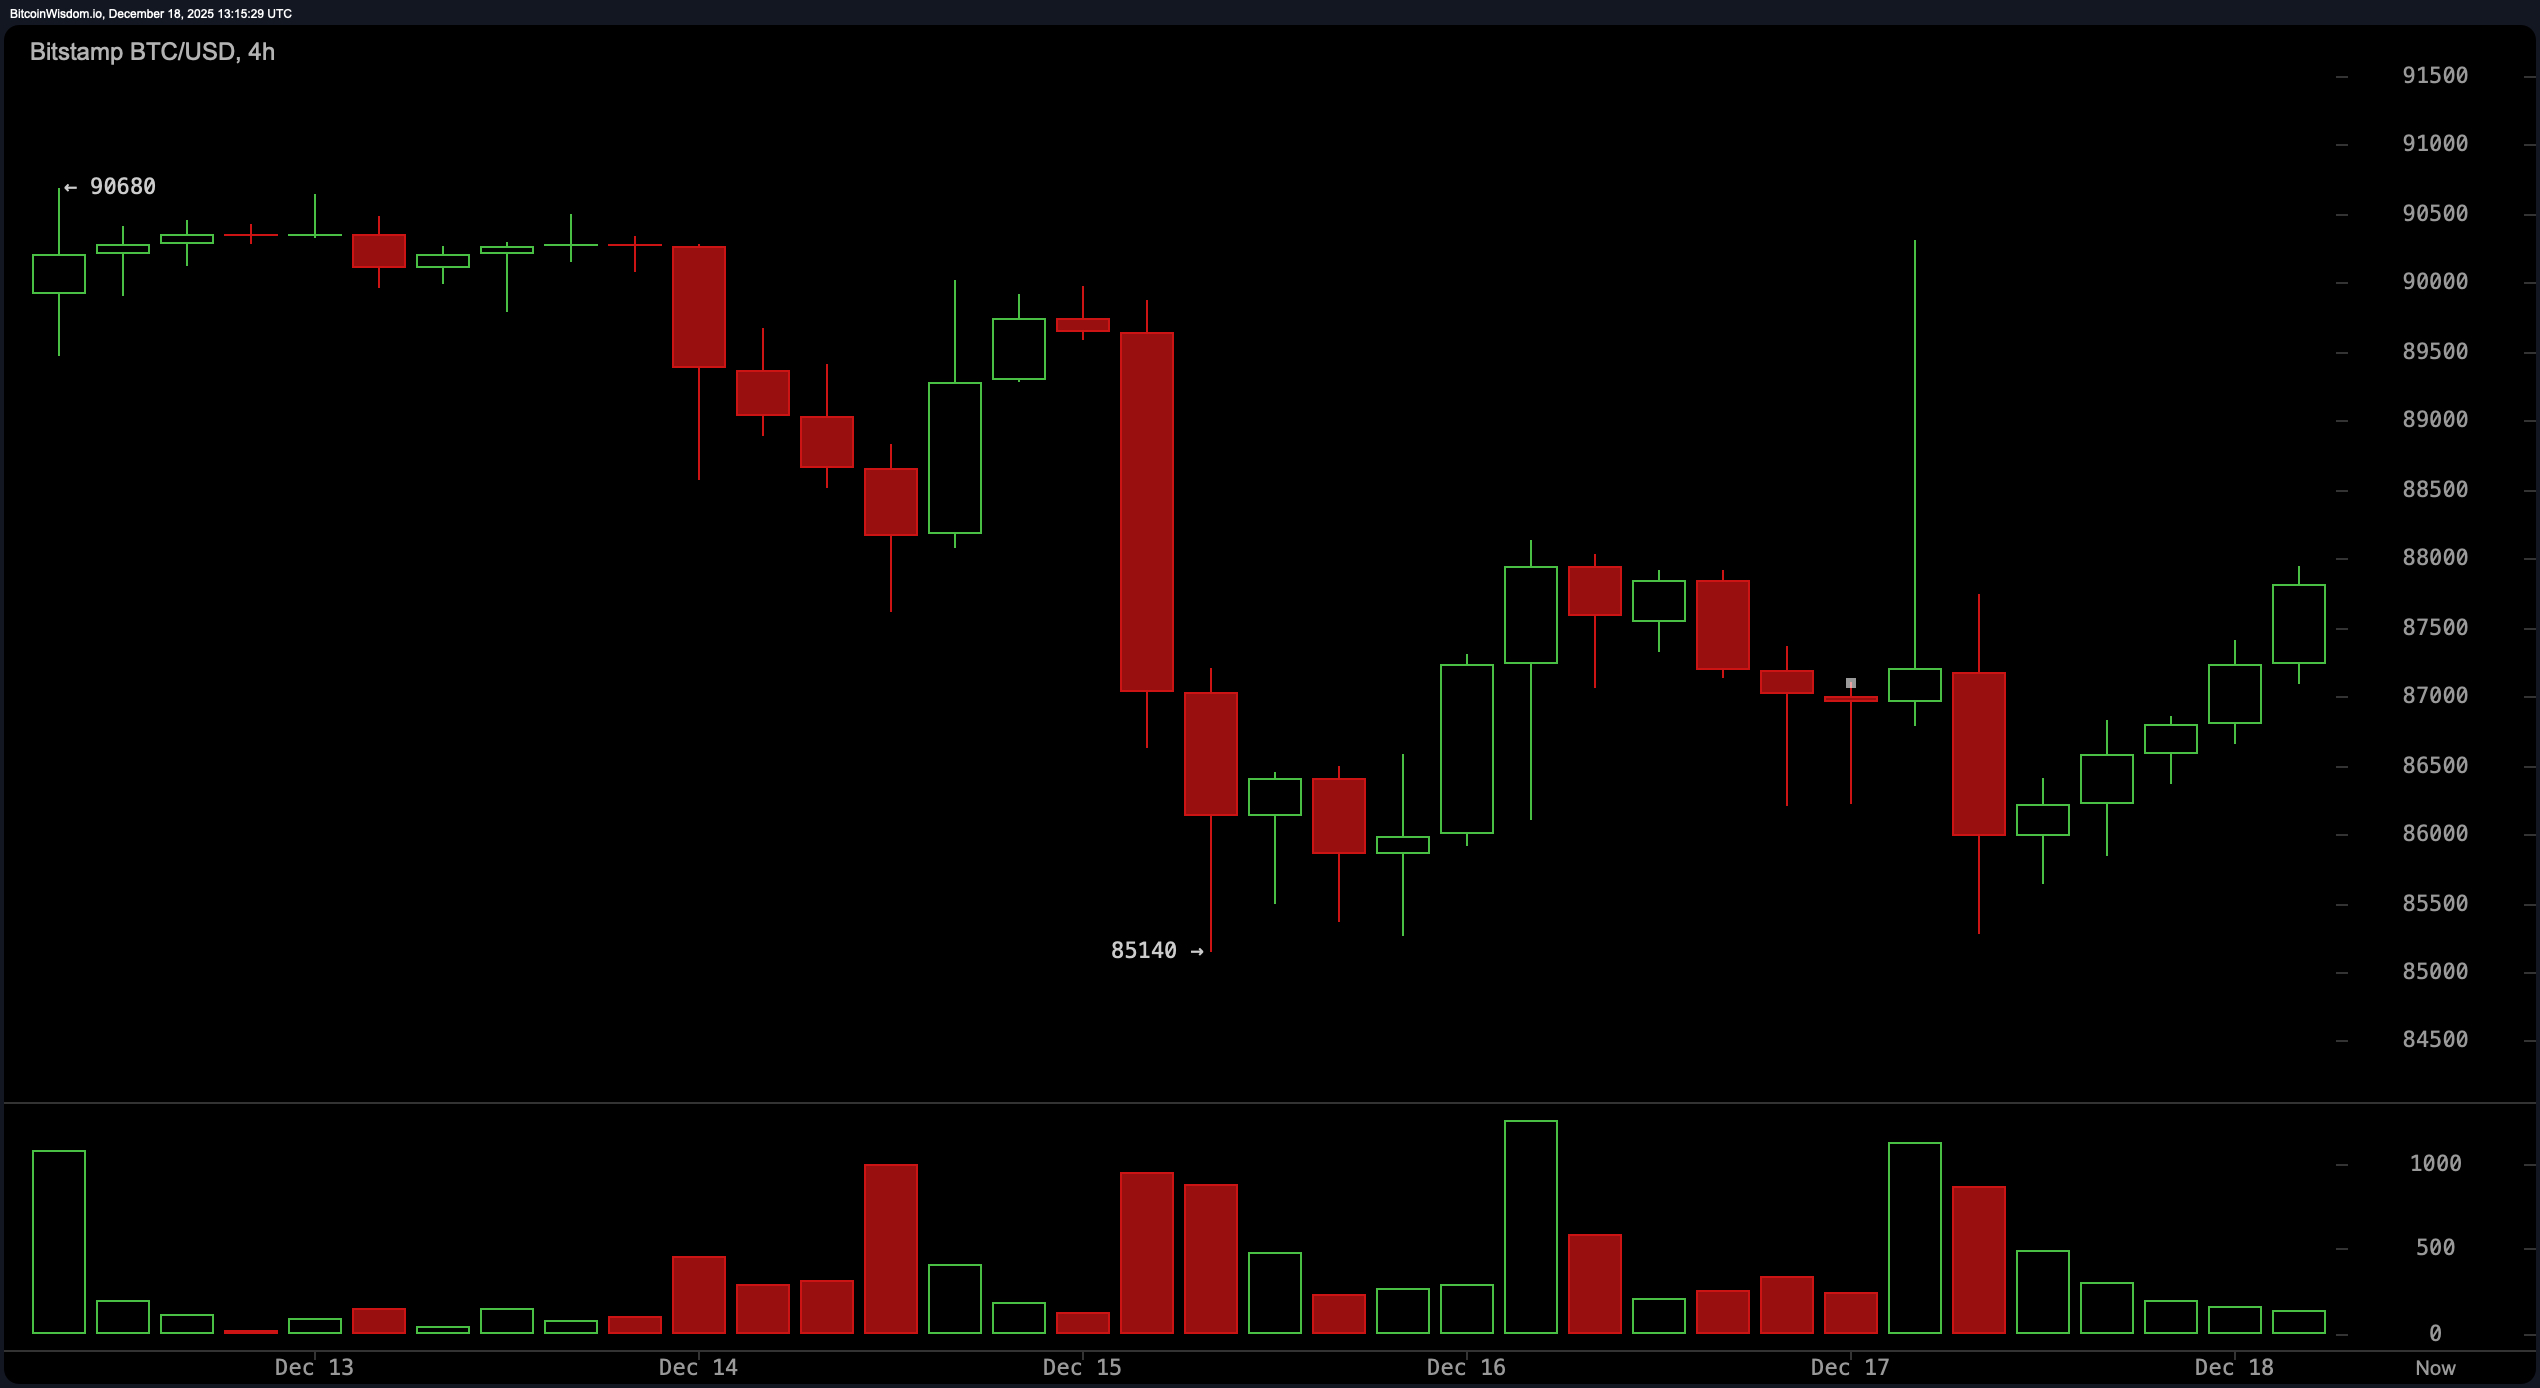
The four-hour chart reveals more complexity. After plunging sharply from roughly $90,600 down to about $85,140 earlier this week, Bitcoin seems to be forming what could become a bullish reversal pattern—possibly manifesting as either a double bottom or higher low formation. Since then it has climbed back toward the $87,500–$88,000 zone with intermittent volume spikes suggesting cautious testing by buyers. However,the exponential moving average (EMA 20) and simple moving average (SMA 20), positioned near $89,752 and $89,891 respectively, still loom overhead as significant resistance levels within this critical price band.
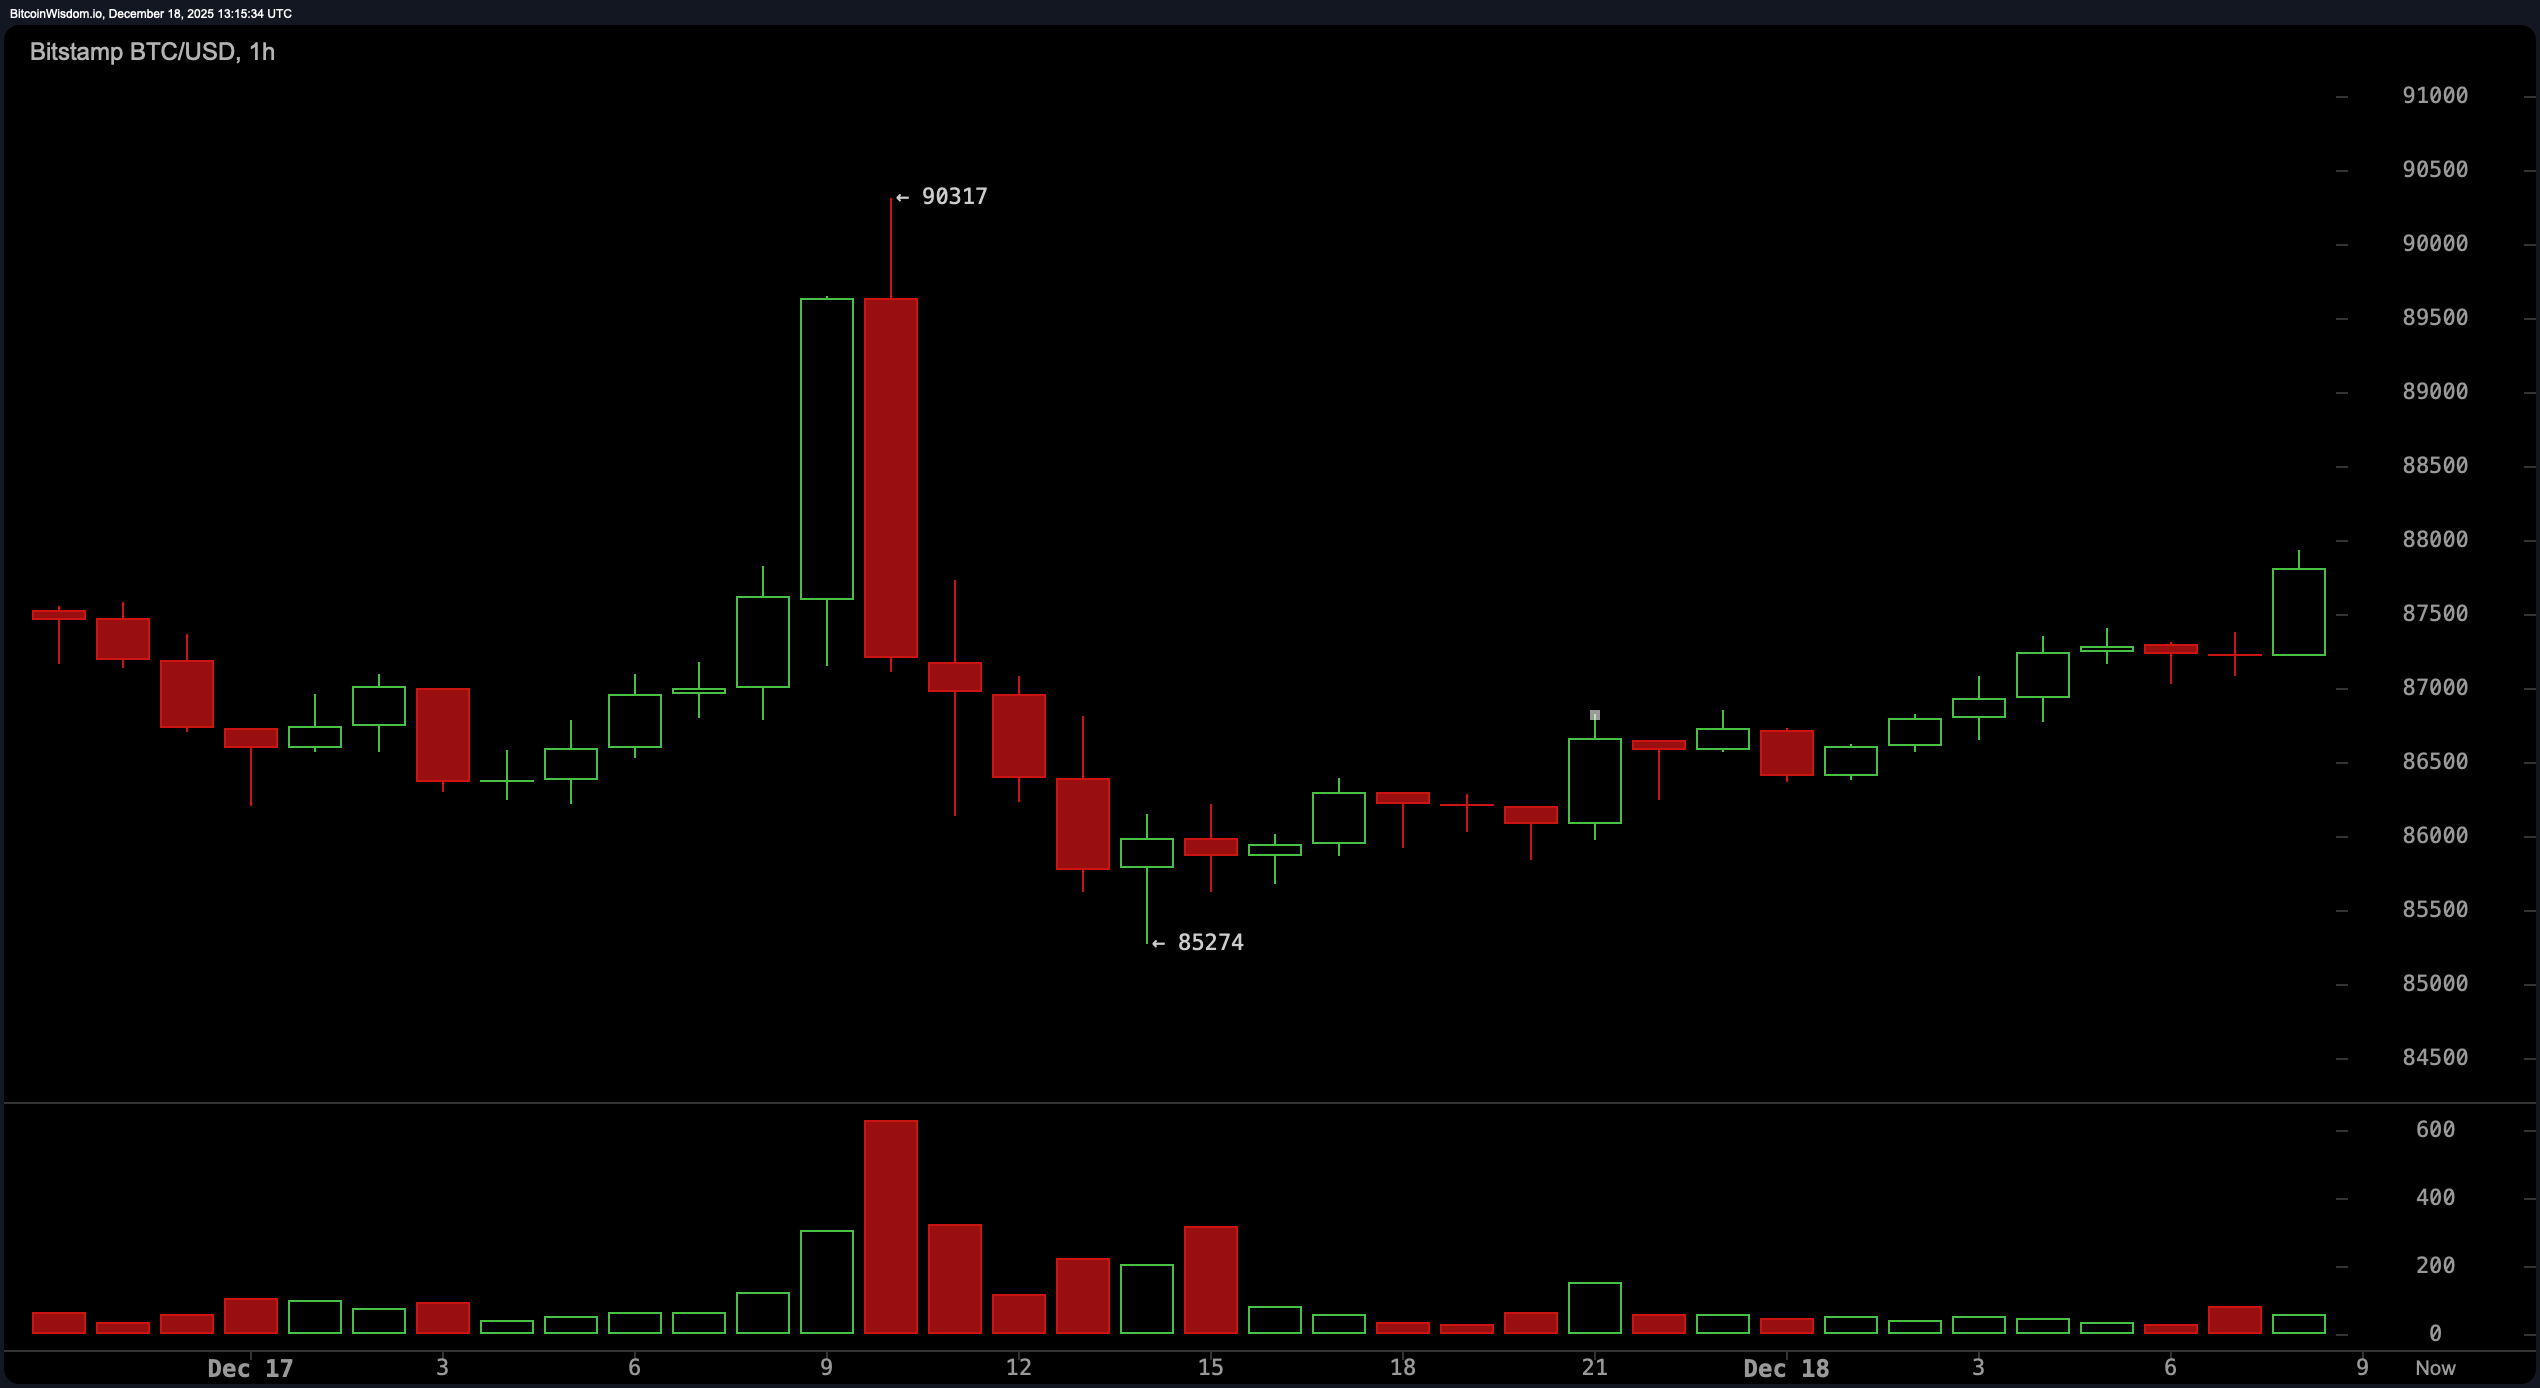
Zooming into short-term action on the hourly chart provides some cautious optimism. Following another steep decline from approximately $90,300 down just above $85,000, Bitcoin has been carving out an ascending trend marked by higher highs and higher lows.
Nonetheless, the accompanying volume lacks strong conviction—it feels more like tentative agreement than enthusiastic support.
The EMA(10)&&&sma(10), hovering near $88,540 &$89,379 respectively, suggest that any sustained upward move will need to overcome these hurdles soon.
A retracement toward roughly $87,000 might offer traders lower-risk entry points if they remain vigilant.
A broader perspective through longer-term moving averages paints an icy picture for Bitcoin’s trajectory.
The 100-period EMA sits at about $100&comma157 while the even loftier 200-period EMA hovers near $102&comma559 — both well above current trading prices.
Even shorter-term averages like SMA50 around $94.
offer no immediate cushion below price action.
This alignment suggests Bitcoin remains mired in correction mode following recent peaks without clear momentum for recovery yet.
In summary, Bitcoin finds itself stuck amid conflicting forces — weary bears reluctant to yield versus cautious bulls seeking confirmation before charging ahead.
Intraday charts whisper hints of opportunity but daily data demands solid proof before embracing any turnaround narrative.
Only breaking decisively beyond ~$90,'';000 accompanied by robust volume would rewrite this story substantially.
Until then,, expect slow-motion chess moves played candle-by-candle across charts worldwide.
Bullish Perspective:
The short-range technicals reveal promising signs characterized by steady recovery patterns featuring rising lows after dips.
If Bitcoin manages firm breakthroughs past resistance zones between ~$88,,500–$90,,000 backed by meaningful trade volumes,
it could ignite wider bullish momentum potentially extending gains further into upcoming sessions.
Both one-hour & four-hour setups imply readiness for continuation provided energy doesn’t dissipate prematurely.
Bearish Perspective:
Despite occasional rebounds,BTC remains trapped beneath crucial ceilings where daily trends still lean bearish.The stacked moving averages overhead combined with MACD negativity plus weak volumes emphasize structural fragility.Unless BTC convincingly reclaims >$90K territory,rallies risk being fleeting & vulnerable.
Frequently Asked Questions 🐂 🐻
<strong>What is bitcoin’s current price?</strong>
As of December18th ,2025 ,bitcoin trades around $ ;87 ,122 .
<p><strong>Is bitcoin trending up or down?</strong>
Short term signals point towards bullishness,but overall direction remains bearish .
<p><strong>What range did bitcoin cover intraday?</strong>
The last twenty-four hours saw prices fluctuate between $ ;85 ,373 – $ ;90 ,164 .
<p><strong What do technical indicators suggest now ?
Mixed readings prevail :momentum is weak while resistance near ninety thousand dollars looms large .