Throughout the years, various metrics and technical analyses have been employed by investors to forecast the lowest point of Bitcoin during each bear market. Some methods have reportedly yielded accurate predictions, while others have diverged significantly from actual outcomes. Recently, a crypto analyst known as @cryptocupra on X (formerly Twitter) has introduced their own prediction for the bottom price using what they call a 23-Bar Theory.
A Historical Perspective on Bitcoin’s Bottoms
In a recent post shared on social media, this analyst detailed how 23 bars have historically indicated the lowest points in previous Bitcoin bear cycles. It appears that these 23 bars were reliable indicators over the last three cycles and may once again signal another bottom.
The analyst elaborates on this theory through an analysis of Bitcoin’s one-month chart, illustrating how many monthly bars are necessary before reaching a bottom. By examining historical data, they highlight that the first instance of this 23-bar theory emerged during the bear market of 2014. This period spanned approximately two years and is depicted in their analysis as an expansion phase that often serves as a launchpad for subsequent bull markets.
By counting monthly closes, it becomes evident that there were exactly 23 monthly bar closes prior to hitting rock bottom. Following this period, Bitcoin’s price rebounded sharply—setting off what would become another bull market cycle.
The crypto analyst notes that this pattern repeated itself during the bear market of 2018; similar to what occurred in 2014, there were between 21 and 23 monthly bars counted before confirming that a bottom had been reached—and subsequently initiating another rally.
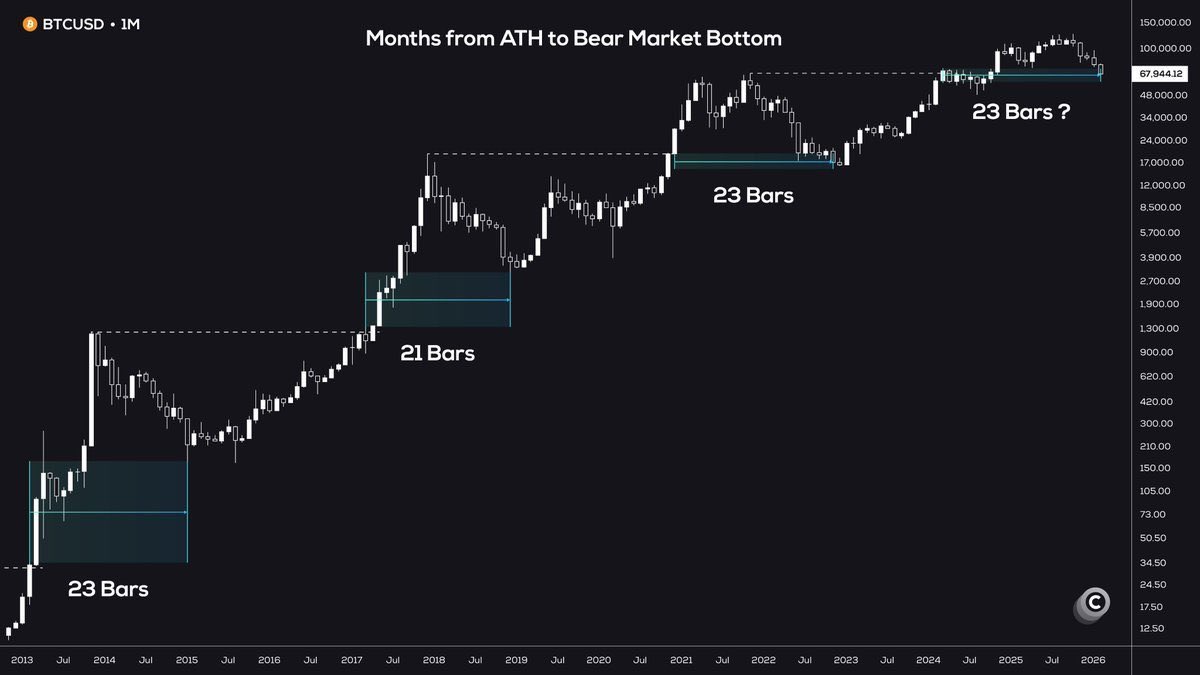
The most recent application of this theory was observed during the bear market in 2022 when once again it was noted that Bitcoin experienced precisely these same patterns with its price movements leading up to its eventual low point before entering into a rally expected between late-2024 and early-2025.
Looking ahead to potentially repeating trends in early-2026, analysts suggest we might be witnessing yet another iteration of these patterns emerging now. If so, it could indicate not only that we’ve reached our current low but also signify an entry into an expansion phase within those anticipated twenty-three bars—possibly heralding yet another bullish run for cryptocurrency prices ahead! According to @cryptocupra’s insights into historical performance trends: history tends not only to repeat itself but also suggests BTC prices are poised for significant upward movement once more!