Bitcoin is currently undergoing a corrective period following its inability to maintain gains above the mid-$90,000 range. The recent price movements suggest a retracement within an established trading band rather than a definitive reversal of trend. However, resistance encountered at crucial moving averages and supply zones has shifted short-term risk dynamics toward further sideways action or potential downward probes before any significant upward momentum can resume.
Daily Bitcoin Price Overview
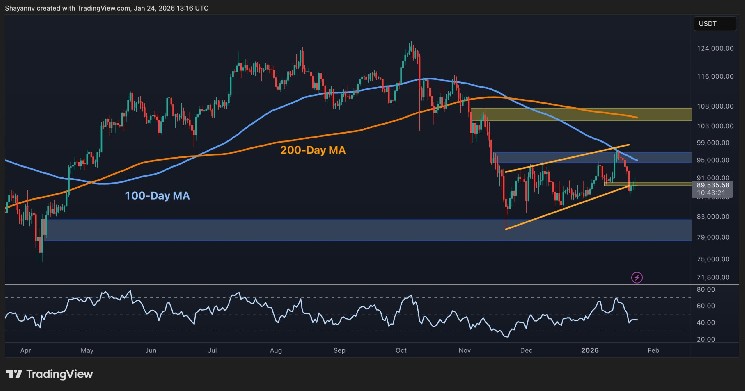
Examining the daily chart reveals that Bitcoin has retreated from the $95,000 resistance area, which coincides with the lower boundary of the 100-day moving average and remains well beneath the declining 200-day moving average. The previously formed ascending wedge pattern originating near $82,000 has broken downwards, with prices now hovering around prior breakout levels and local support between $89,000 and $90,000.
Provided that prices stay capped below the 100-day moving average and fail to reclaim this broken wedge formation, market conditions favor consolidation within a range spanning roughly from $82,000–$84,000 on demand side up to $95,000–$97,000 on supply side. There remains notable risk for deeper declines toward lower support if attempts at rebounds continue facing selling pressure.
BTC/USDT Four-Hour Chart Insights
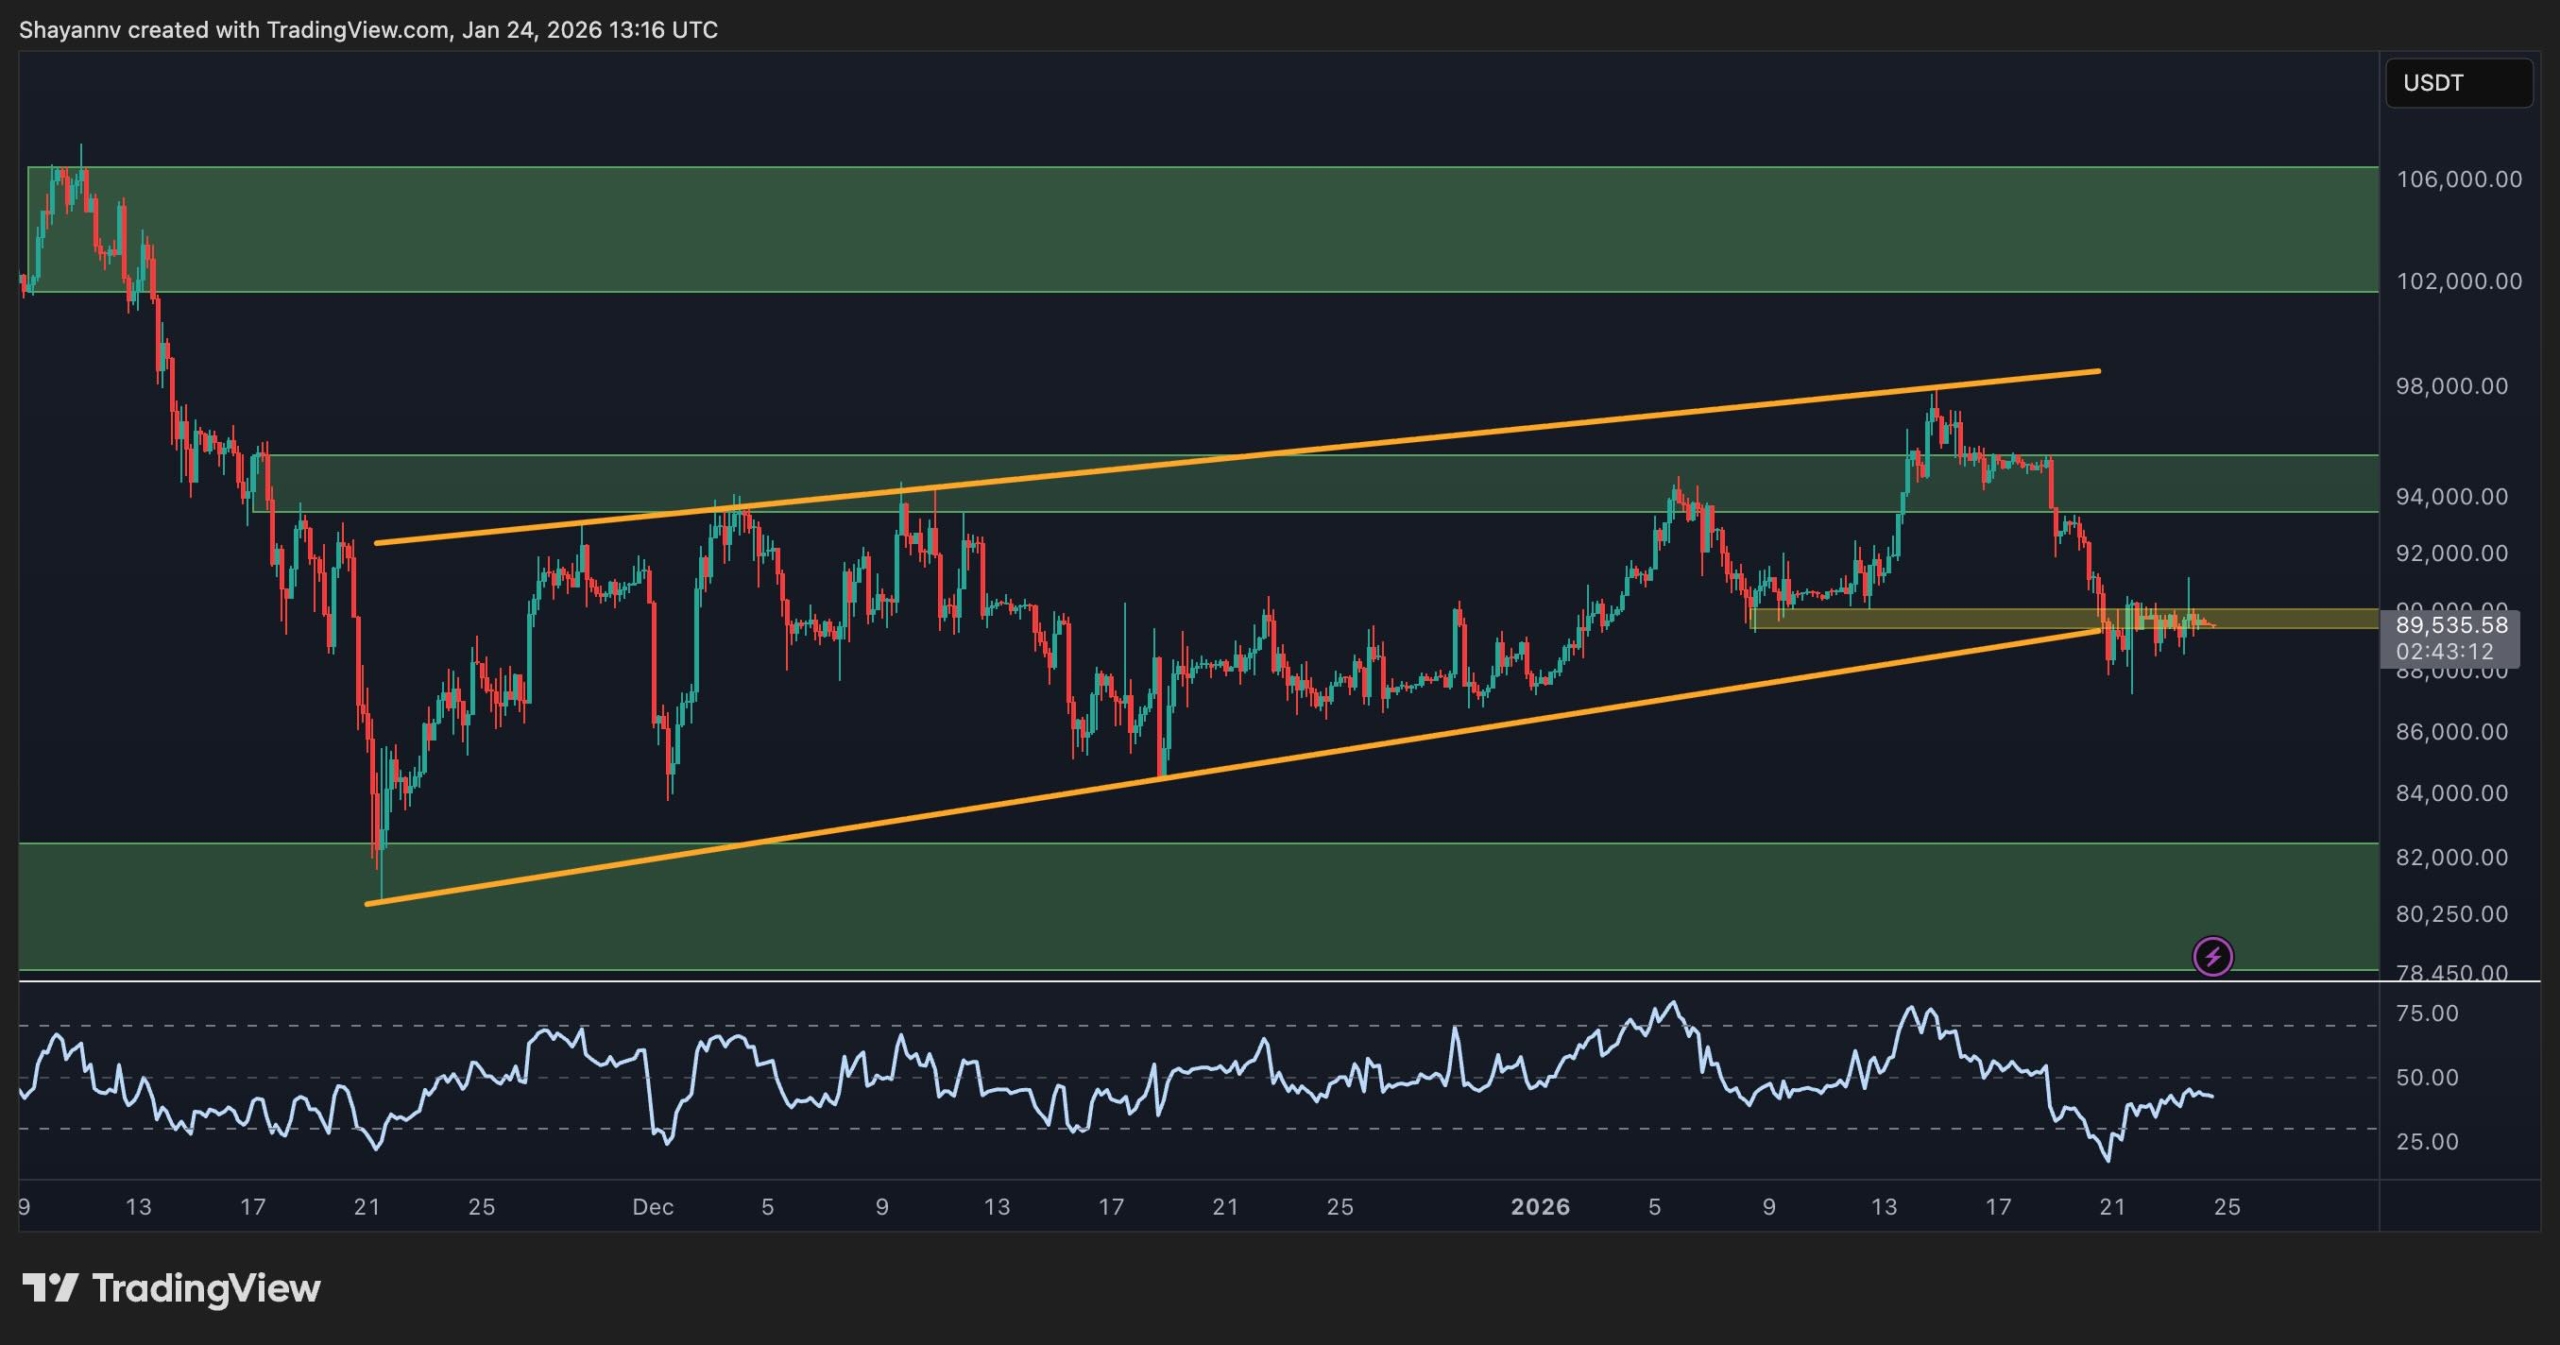
The four-hour timeframe illustrates how Bitcoin broke down from an ascending channel that propelled it from about $84,000 up to nearly $96,000 recently. After losing both channel support and key intraday pivot near $90K levels,the price found tentative footing just above approximately $88K–$89K—an area marking origins of previous bullish momentum.
The RSI indicator on this timeframe bounced back from oversold conditions but still lags behind earlier highs indicating only a temporary corrective rebound amid short-term bearishness. A sustained move beyond around $92K could pave way for testing resistance near $95K again while failure to hold above current supports might increase odds of dropping towards daily demand zones close to or below roughly $82K.
Insights From On-Chain Metrics
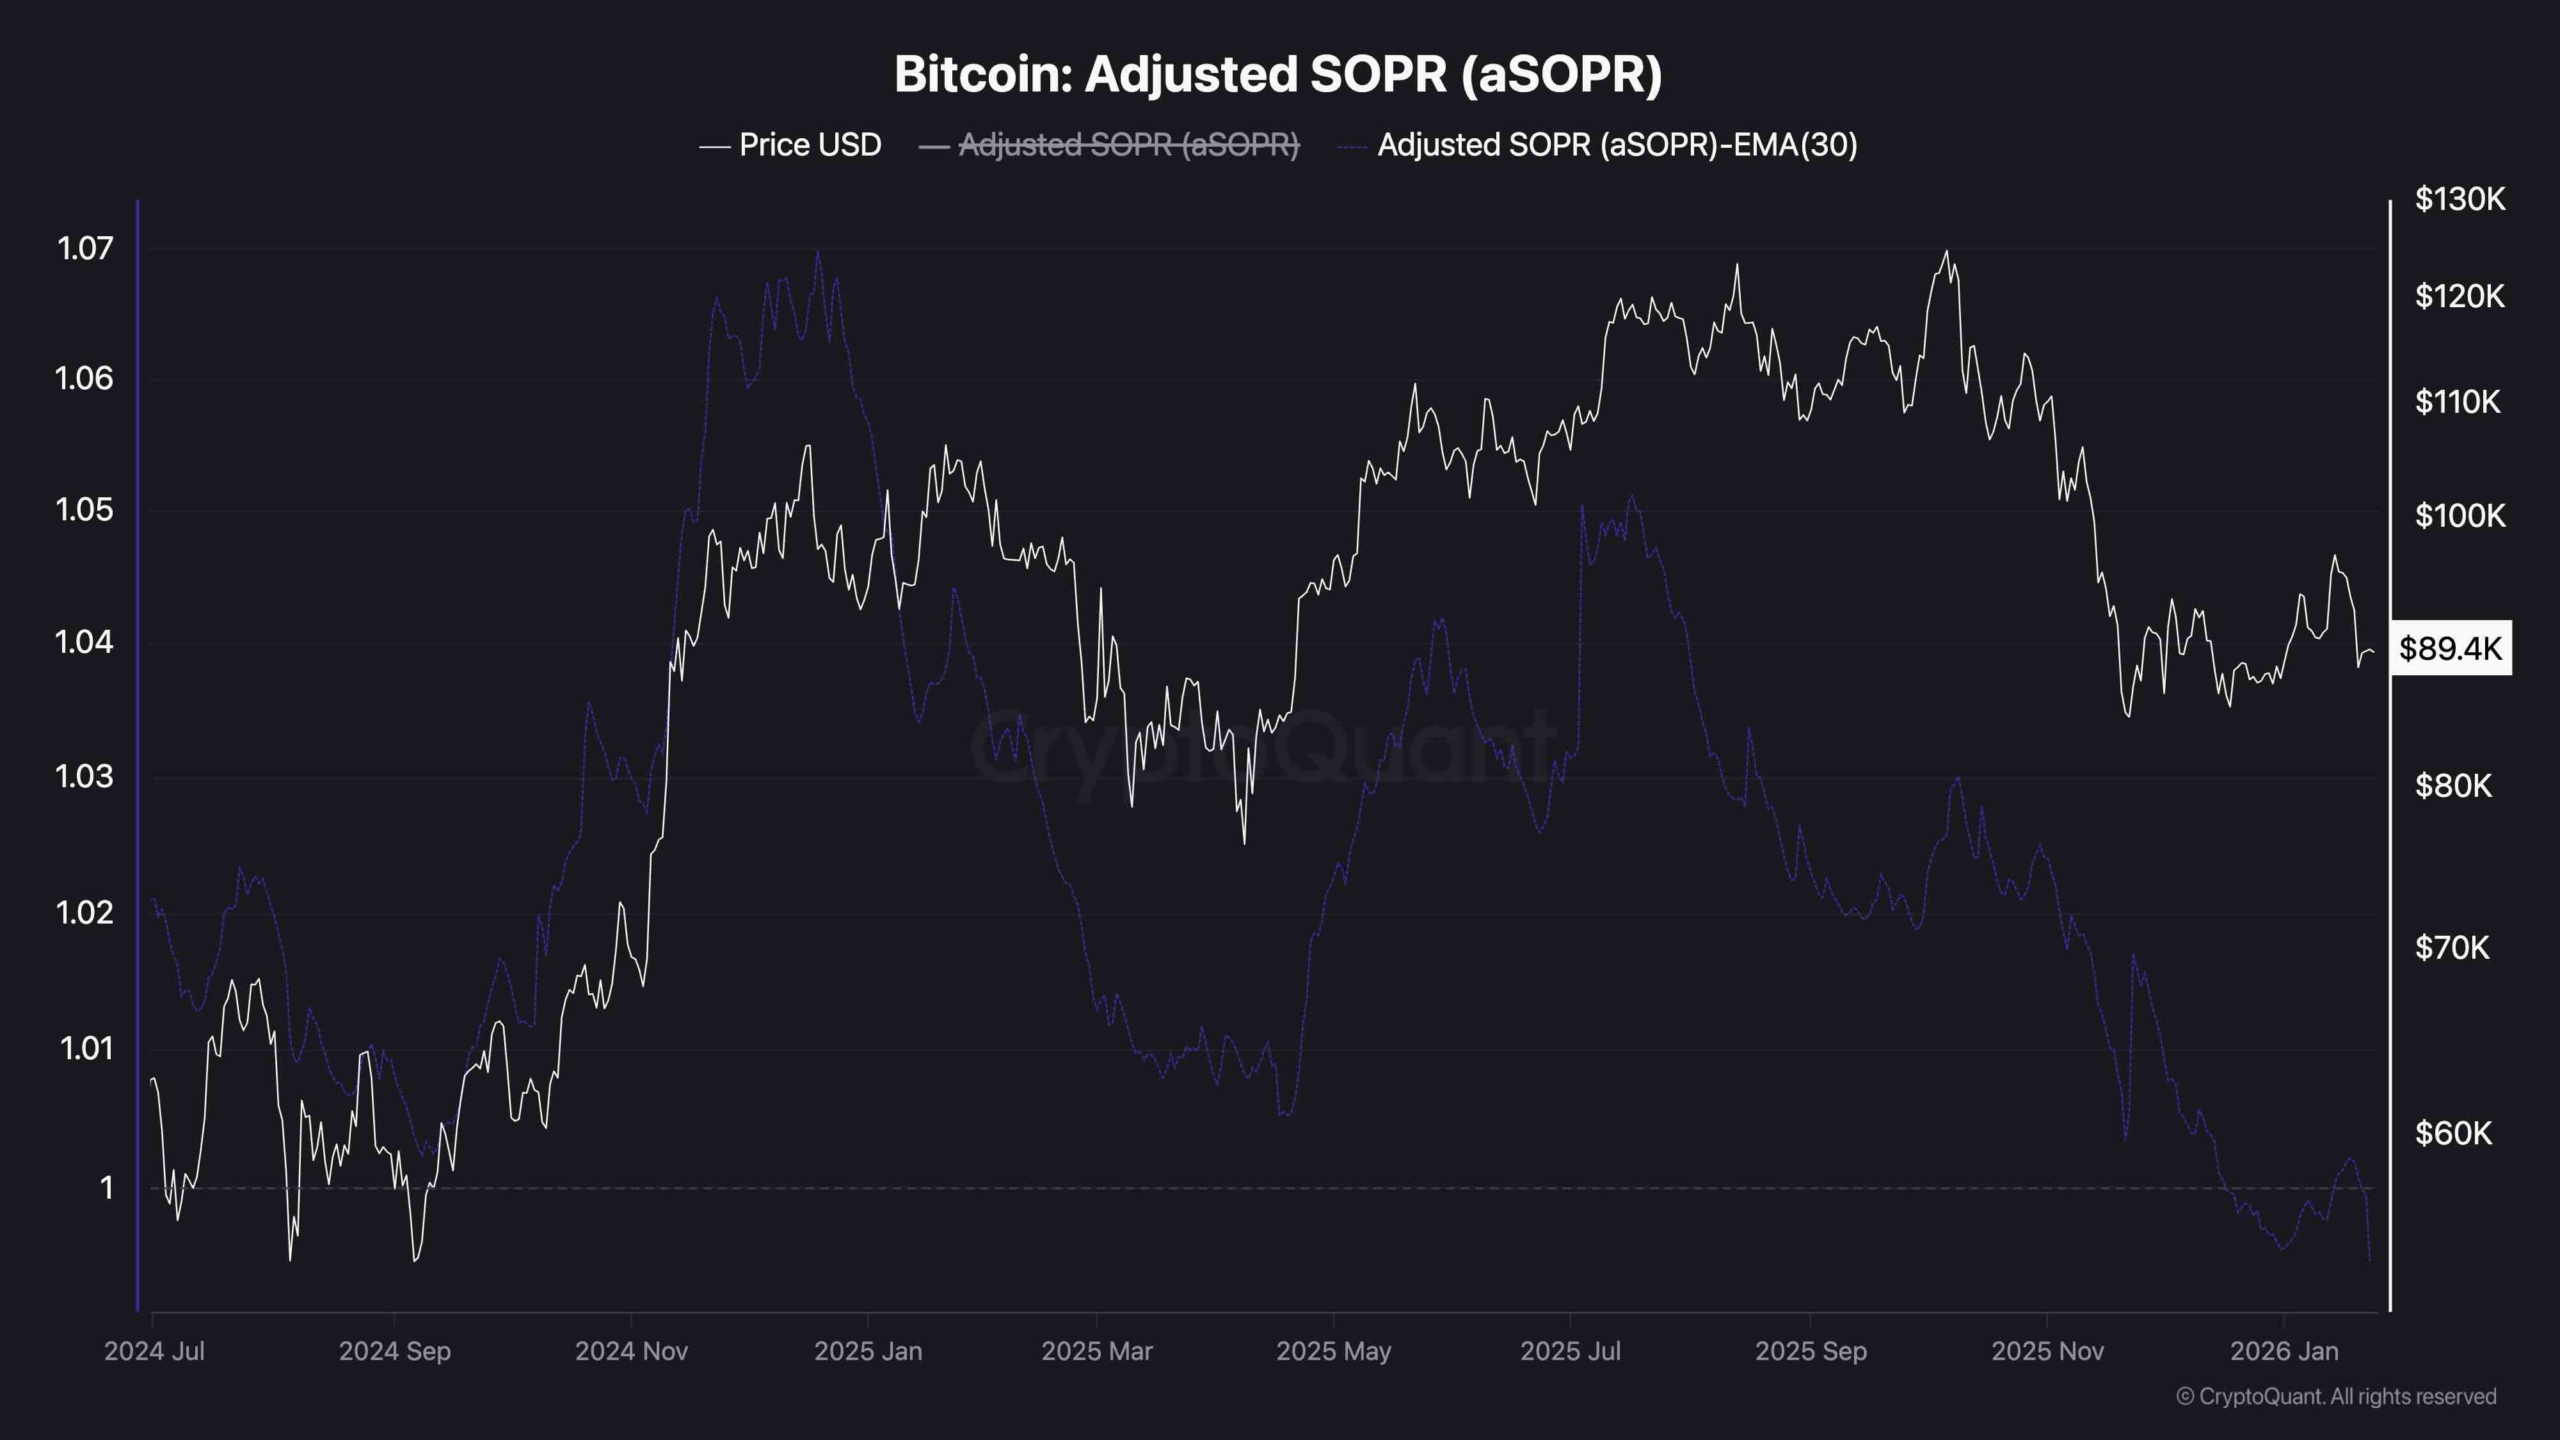
The adjusted Spent Output Profit Ratio (aSOPR) along with its 30-day exponential moving average have been trending downward over several months—from clearly profitable ranges exceeding values between 1.03–1.04 down towards neutral levels around one (1). This trend suggests shrinking realized profits upon coin sales as more holders are offloading assets close to breakeven points—with occasional phases where losses are realized when aSOPR dips under one.
This structural decline in profitability often signals late-cycle or post-euphoria stages where speculative enthusiasm wanes while weaker investors exit positions gradually.
If aSOPR stabilizes near one while price respects longer-term supports,it would imply healthier market conditions characterized by marginal seller exits without widespread capitulation events.On contrary,a prolonged drop in its 30-day EMA below one would indicate intensified profit-taking alongside loss realization consistent with extended correction phases ahead.