Bitcoin is nearing a significant resistance zone, with technical signals and market dynamics hinting at a potential breakout. Traders are paying close attention to momentum indicators, while shifts in derivatives trading and exchange flows reveal evolving market engagement.
Recent price movements indicate growing bullish momentum as Bitcoin has consistently formed higher highs and higher lows since late February. As a result, analysts are closely watching whether buyers can sustain strength above the crucial support level near $69,900.
Building Bullish Momentum
The cryptocurrency currently trades above important Fibonacci retracement points, boosting confidence among short-term investors. Additionally, it remains firmly positioned above the Ichimoku cloud—a key indicator often associated with continued upward trends.
The ascending Tenkan and Kijun lines further suggest that buyers retain control over the immediate trend direction. Meanwhile, the Average Directional Index (ADX) hovers around 23 and continues to rise, signaling strengthening trend momentum.
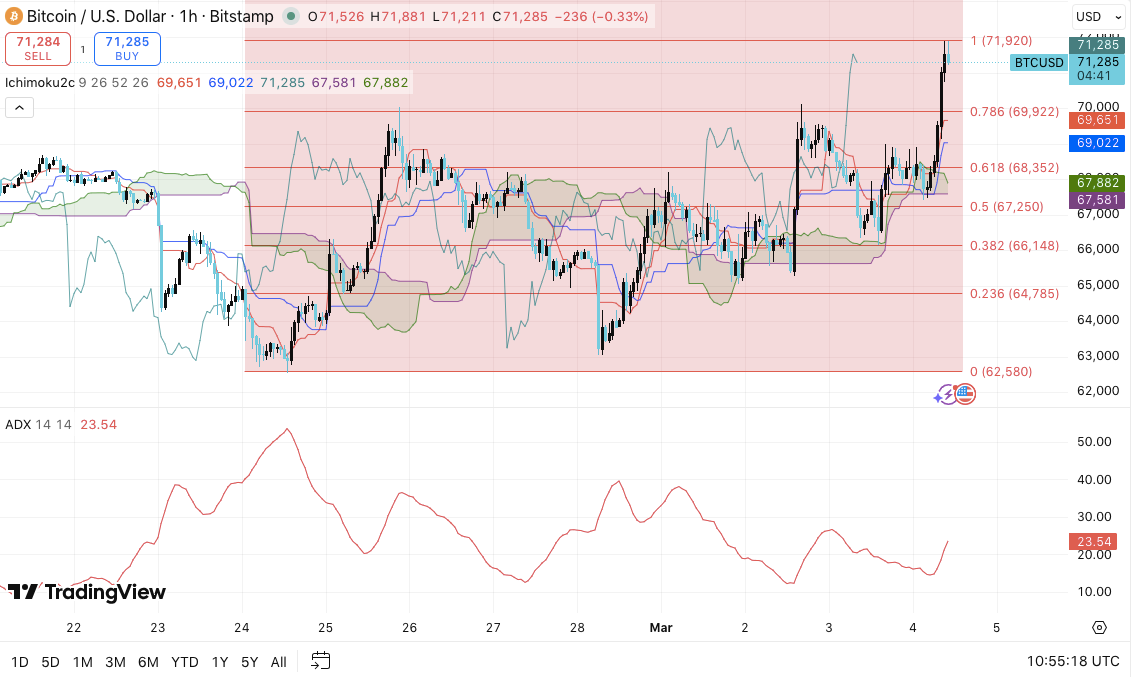
A decisive break above the $71,920 resistance could ignite stronger upward movement. Market experts anticipate subsequent liquidity clusters near $73,000.
If this breakout extends further, gains might reach into a broader resistance range between $75,000 and $76,000—levels known for psychological significance where selling pressure typically intensifies.
Related: Ethereum Forecast – ETH’s Uptrend Continues Amid Vital Network Discussions
Nonetheless, Bitcoin faces considerable opposition close to its recent peak around $71,900. Sellers have previously defended this threshold effectively—causing hesitation among traders seeking aggressive breakouts.
If price rejection occurs again here, a pullback toward support at approximately $69,900 may follow. Deeper declines could test levels near $68,350 or even approach roughly $67,250—zones that historically attracted buying interest during consolidation phases.
These areas are often regarded by traders as attractive dip-buying opportunities within an overall uptrend context. A breach below these supports might weaken short-term bullish momentum temporarily shifting market sentiment downward.
The Role of Derivatives & Exchange Flows
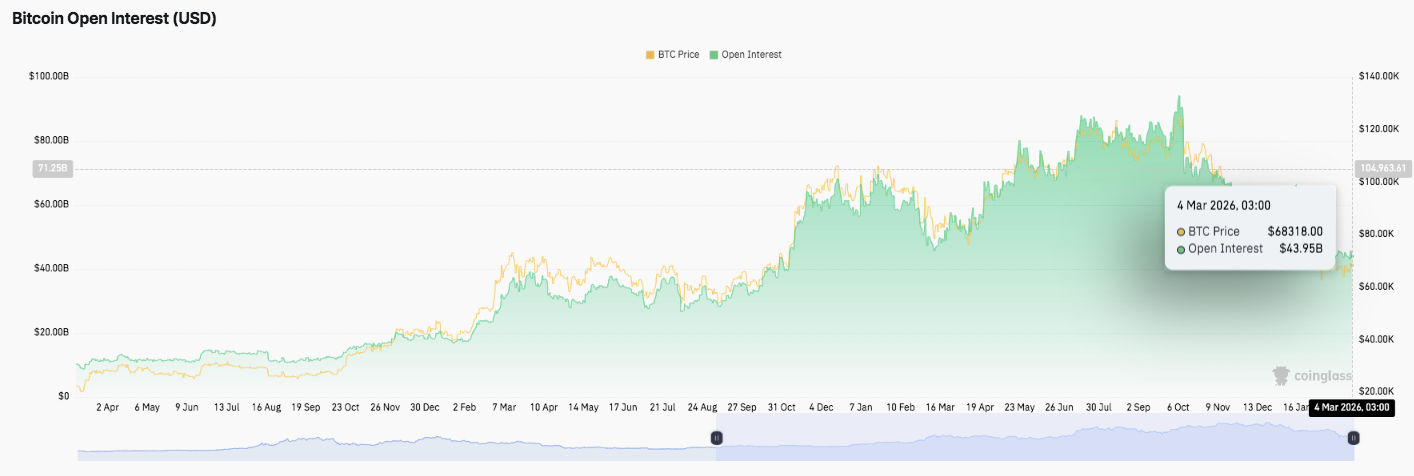
Source: Coinglass
Beyond traditional technical tools, derivatives markets provide valuable insights into trader behavior. The open interest surged dramatically during recent rallies as leveraged positions expanded—from under $20 billion up to nearly $90 billion.
Periodic corrections triggered liquidations that temporarily reduced open interest across various platforms.
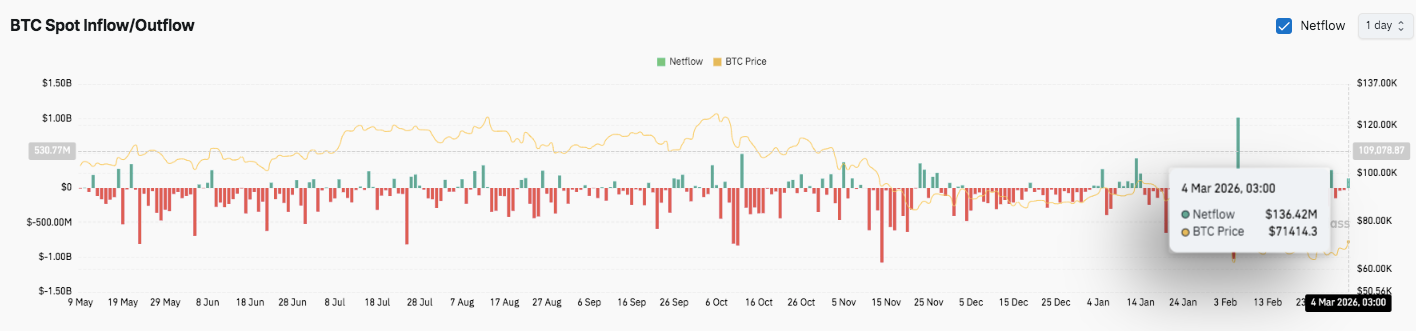
Source: Coinglass
This broader pattern still reflects increasing capital inflow into Bitcoin markets.
Currently, base-level open interest stands around $44 billion while prices hover near $68,000. Exchange flow data also reveals notable shifts in investor activity—with prior months marked by consistent outflows indicating long-term holders withdrawing coins from exchanges for safekeeping.
An Analytical View on Price Levels
Certain critical thresholds define Bitcoin’s path amid its ongoing recovery attempt:
- Upside targets: $71,Θ represents immediate resistance where rejections recently occurred. A confirmed move beyond this point may propel prices toward liquidity zones between $73,�–$74,�.
If bullish forces strengthen further, sizable targets lie at approximately $75,Ǵ and $76,�. - Downside supports:$69,900 serves as initial support aligned with 0.786 Fibonacci retracement plus recent breakout territory.
Below lies firmer backing at about $68,350 (0.618 Fibonacci), followed by mid-range retracement near $67,250.
A deeper correction risks exposing lower floors such as ~$66,148 alongside structural bases spanning from ~$64,785 down to ~$62,580.
Main Resistance Barrier &a Potential Breakout Catalyst
$71&x201C;,920 remains pivotal — only if flipped successfully into support will it confirm enhanced short-term bullish strength.
Clearing this hurdle could spark continuation moves powered by rising derivatives activity coupled with improving participation metrics.
Technically speaking,
Bitcoin trades comfortably atop Ichimoku cloud layers signifying favorable bull structure.
The Tenkan &; Kijun lines continue their ascent implying buyer dominance persists
Momentum gauges like ADX steadily climb towards stronger trend zones suggesting transition from consolidation phase towards directional advance.
Will Bitcoin Ascend Further?
The immediate future depends heavily on whether bulls can defend key support near $
69&x002C;
900 whilst building enough pressure beneath strong resistance just shy of $
71&x002C;
920.
Sustained hold over these levels would enable attempts targeting $
73&x002C;
000 region potentially extending gains closer towards $
75&x002C;
00 or beyond.
Conversely rejection here might trigger corrective dips back down towards favored buy-the-dip zones around
68,
350 or 67,
250 within an overarching positive trajectory.
At present,
Bitcoin stands at a crossroads where technical formations combined with derivative trends plus exchange flow data collectively shape upcoming moves.
Increasing open interest alongside improving momentum hints growing confidence yet ultimate confirmation awaits successful breakthrough paired with firm retention above critical
support.
Related:
River Price Outlook:
RIVER Consolidates Post-Rally While Market Signals Cautious Reentry
Disclaimer:
This article is intended solely for informational purposes without constituting financial advice.
Coin Edition disclaims responsibility for any losses arising from use of content herein.
Readers should exercise prudent judgment before making investment decisions related to mentioned entities.