Bitcoin (BTC) has recently dipped below the pivotal $110,000 support level, entering a phase of extended consolidation. A trading expert has pinpointed critical price points to monitor during this period.
Ted Pillows’ analysis highlights that Bitcoin’s limited movement resembles that of a stablecoin, potentially signaling impending volatility. He shared these insights in an X post dated September 28.
At present, the $107,000 threshold serves as immediate support for Bitcoin. Should this level fail to hold, Pillows suggests that Bitcoin might descend towards the $100,000 region where demand is anticipated to be stronger.
Conversely, if Bitcoin can reclaim the $113,500 mark, it would empower bullish traders and pave the way toward reaching $118,000 and possibly encountering resistance at $124,000.
Bitcoin Price Remains in Uncertain Territory
The current indecision among traders has prompted BitBull‘s analysis offering another perspective on Bitcoin’s situation.
The analyst identifies $111,972 as a crucial point for bullish momentum. Surpassing this figure could shift dynamics back into an upward trend and may confirm continued bullish behavior. Below this mark lies what they term as the “chop zone,” characterized by sideways market movements.
If prices drop further down to around $105,100—a significant support area—it would reinforce bearish trends guiding price action since mid-August.
An Overview of Current Bitcoin Trends
As of now—Bitcoin trades at approximately $109,423, marking a slight increase of about 0.01% over 24 hours but showing more than 5% correction on weekly charts.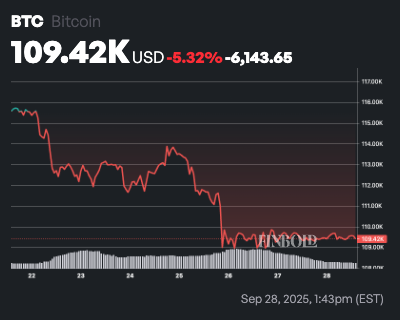
This places its value beneath its SMA, indicating short-term bearishness due to underperformance compared with recent averages.(SMA:$114,.$166).