
Bitcoin (BTC) appears to be on the verge of a substantial correction, as a significant bearish technical indicator has emerged on the three-day chart, suggesting a potential decline towards the $36,000 mark.
Insights shared by TradingShot in a post on TradingView dated March 6 indicate that this prediction is based on the formation of a death cross within the three-day timeframe.
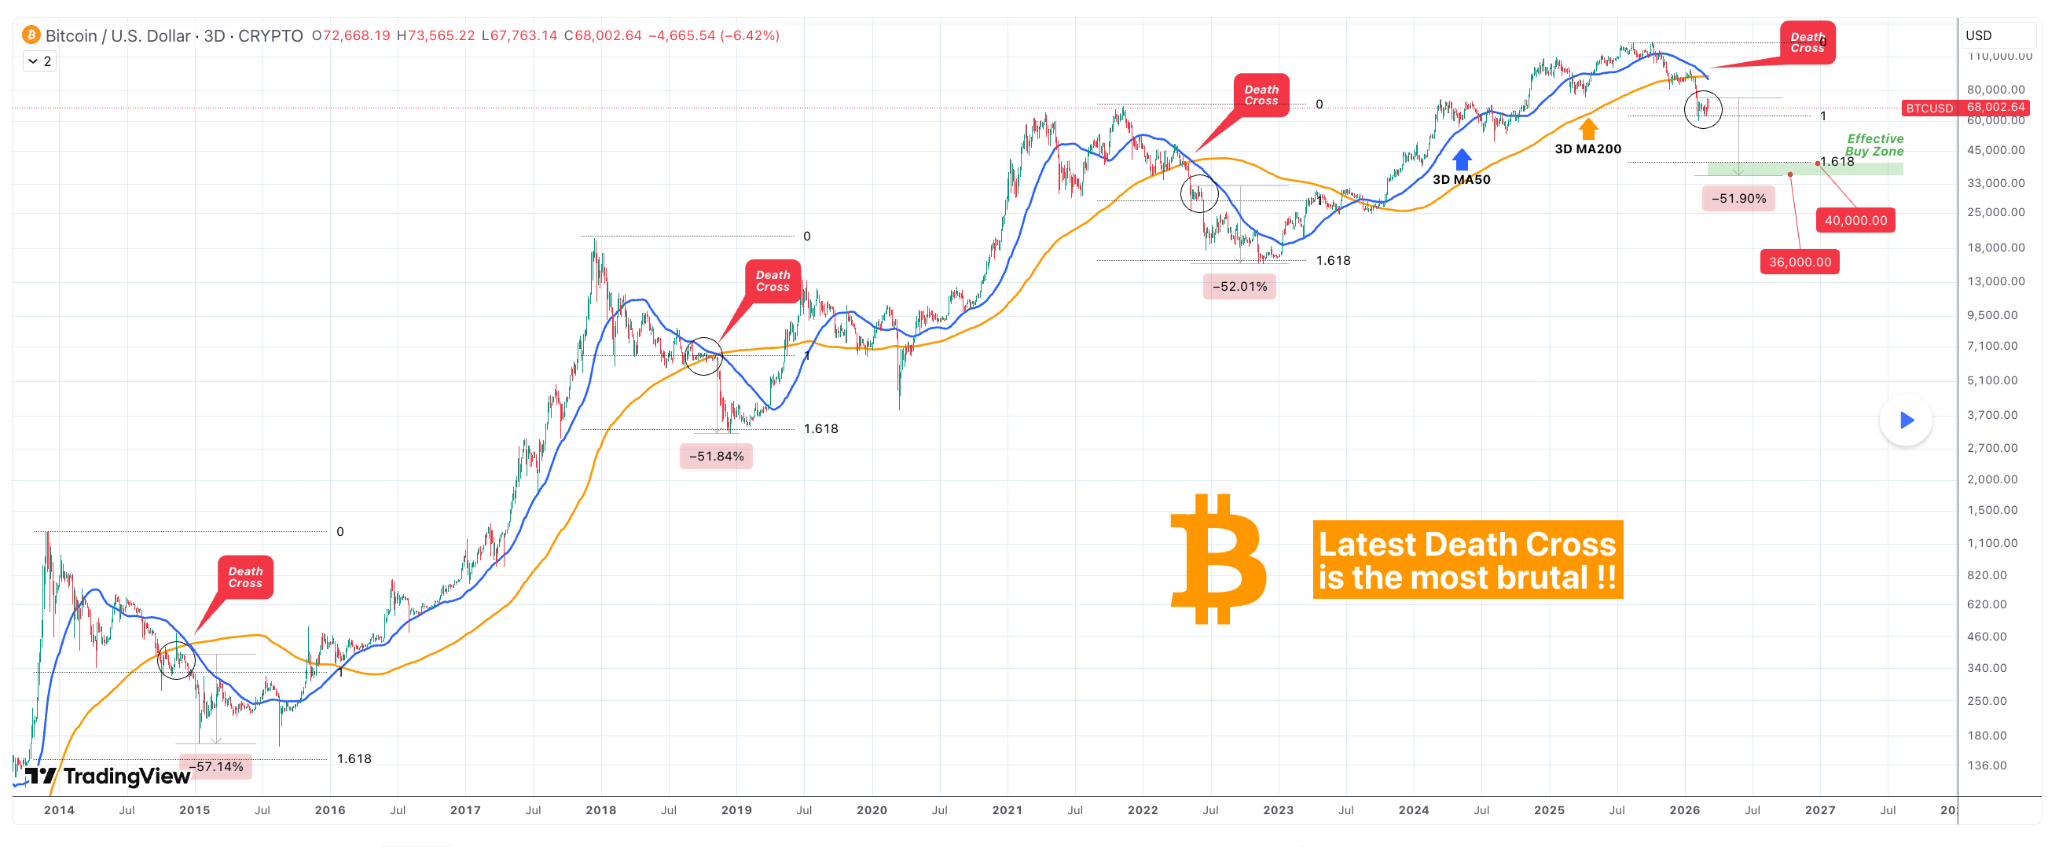
This pattern is characterized by the 50-period moving average (MA50) dropping below the 200-period moving average (MA200). Historically, such signals have been associated with major bear markets and have often preceded significant declines in Bitcoin’s price.
An analysis of past occurrences reveals that each time this pattern appeared during bear market phases since 2014, Bitcoin experienced sharp declines following the crossover. For instance, during both the downturn in 2022 and crypto winter of 2018, Bitcoin fell over 52% after this signal emerged. In fact, during earlier cycles like that of 2014, losses were even steeper at around 57%.
The current situation shows MA50 trending downward and crossing beneath MA200—confirming this bearish crossover. Additionally, Bitcoin is trading below both averages after losing momentum near $70,000—a scenario historically indicative of weakening market strength.
The Next Target for Bitcoin
If historical trends hold true for this cycle as well, we could witness a similar decline for Bitcoin. A projected drop of approximately 52% from where it crossed would place its value around $36,000—this aligns with key Fibonacci extension levels observed at previous bottoms during bear markets in both 2018 and 2022.
This historical behavior leads analysts to identify an accumulation zone between $40,000 and $36,000; with $40K corresponding to Fibonacci extensions while $36K reflects typical post-death cross declines seen previously.
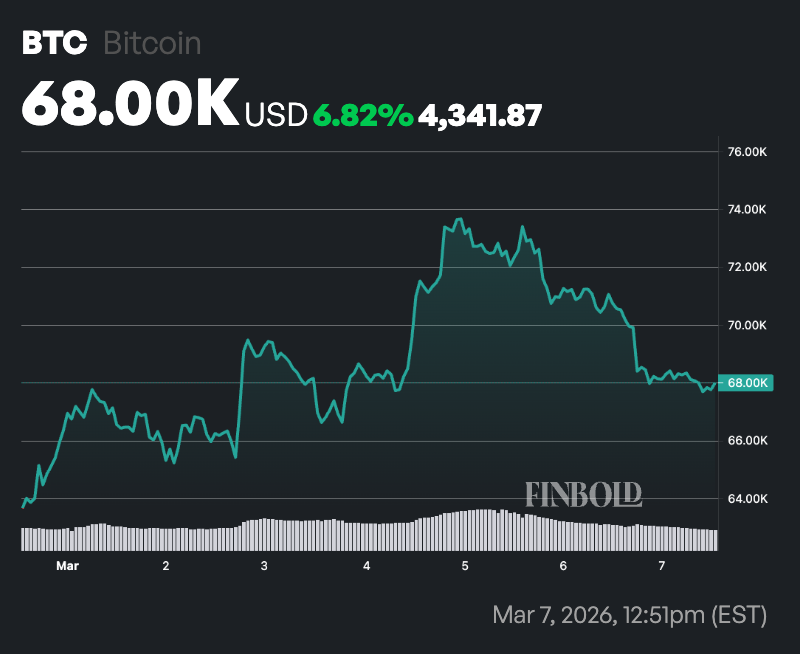
This pessimistic outlook follows an impressive rise where cryptocurrency prices surged close to $74K between March 4-5—a one-month peak that briefly reignited trader optimism.
The rally was fueled by short squeezes alongside renewed investments into spot Bitcoin ETFs amid rising geopolitical tensions in regions like the Middle East which contributed to perceived resilience within markets.
Diverging from traditional patterns however was how during this rally; Bitcoin moved concurrently with an appreciating U.S dollar—a correlation not typically seen since late last year (2024).
Nevertheless; momentum swiftly diminished leading to pullbacks erasing much gains made throughout that week!
An Analysis Of Current Prices
As per recent reports; current pricing places BTC at about $67k—significantly lower than its SMA over fifty days ($75k) & considerably beneath two hundred day SMA ($96k).
Navigating below these moving averages generally indicates bearish conditions while highlighting ongoing pressure against broader trends!
Momentum indicators offer contrasting insights though! Currently standing at RSI level(14-days)of around45.93 puts it squarely within neutral territory measuring speed/magnitude fluctuations across price movements ranging from zero up till hundred!