
Bitcoin is trading between $111,851 and $112,121 over the past hour, trading in a tight daily band between $110,456 and $113,537 as market signals diverge. With a market cap of $2.23 trillion and $80.54 billion in 24-hour volume, the price action reflects a high-stakes pause in momentum.
Bitcoin
The daily chart reveals bitcoin is attempting to stabilize after a volatile rejection from its recent peak of $126,272. A cascade of red candles, including a high-volume bearish engulfing formation, drove the price down to a local low of $108,652. While recent sessions have shown minor attempts to reclaim higher levels, they have been underwhelming, with weak bullish responses failing to break above the $115,000 threshold.
Momentum remains tilted downward as short-term moving averages—including the 10-, 20-, 30-, and 50-period exponential and simple moving averages—remain firmly above the current price. Volume during the breakdown suggests capitulation, but the follow-through recovery has lacked conviction.
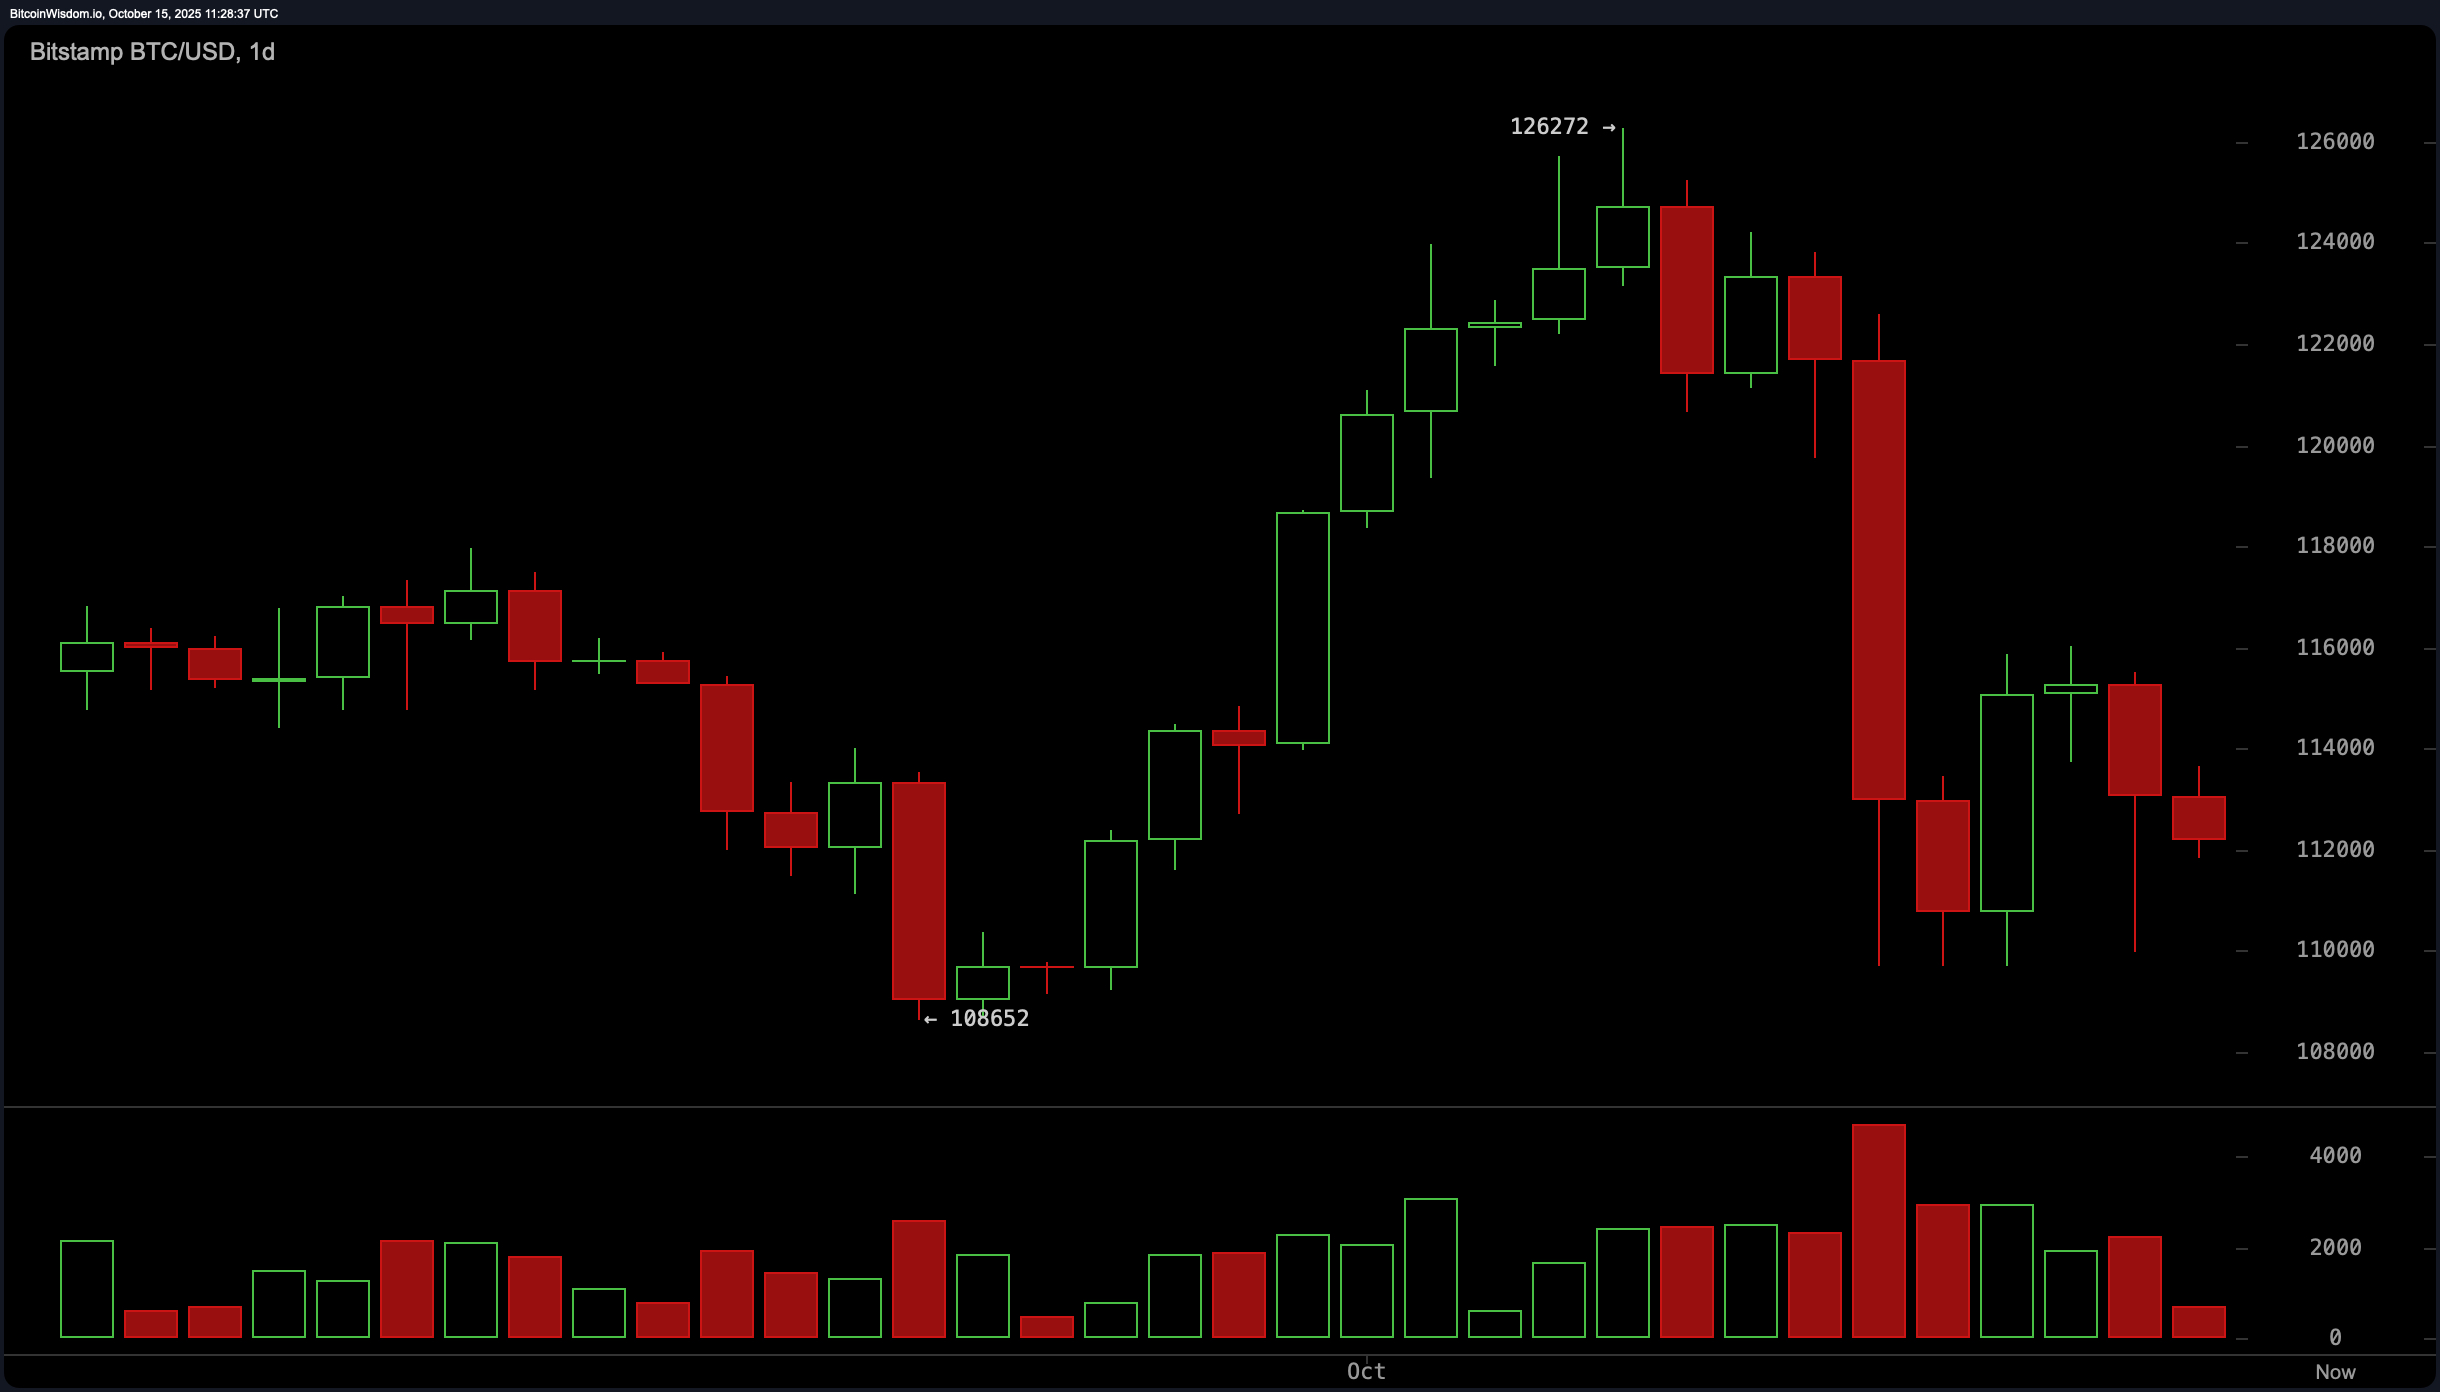
BTC/USD 1-day chart via Bitstamp on Oct. 15, 2025.
On the 4-hour chart, bitcoin’s structure is shaped by a classic bear flag following the drop from $122,582 to $109,683. Despite an initial rebound, price action has remained range-bound between $112,000 and $114,500, with each attempt to break above $114,000 facing rejection. The pattern suggests further downside potential, especially if price decisively breaks below $111,500. Volume has steadily declined during the recovery phase, a typical hallmark of weak demand. Should bitcoin clear $114,800 with volume, it would invalidate the bearish structure and shift short-term expectations upward toward $117,000.
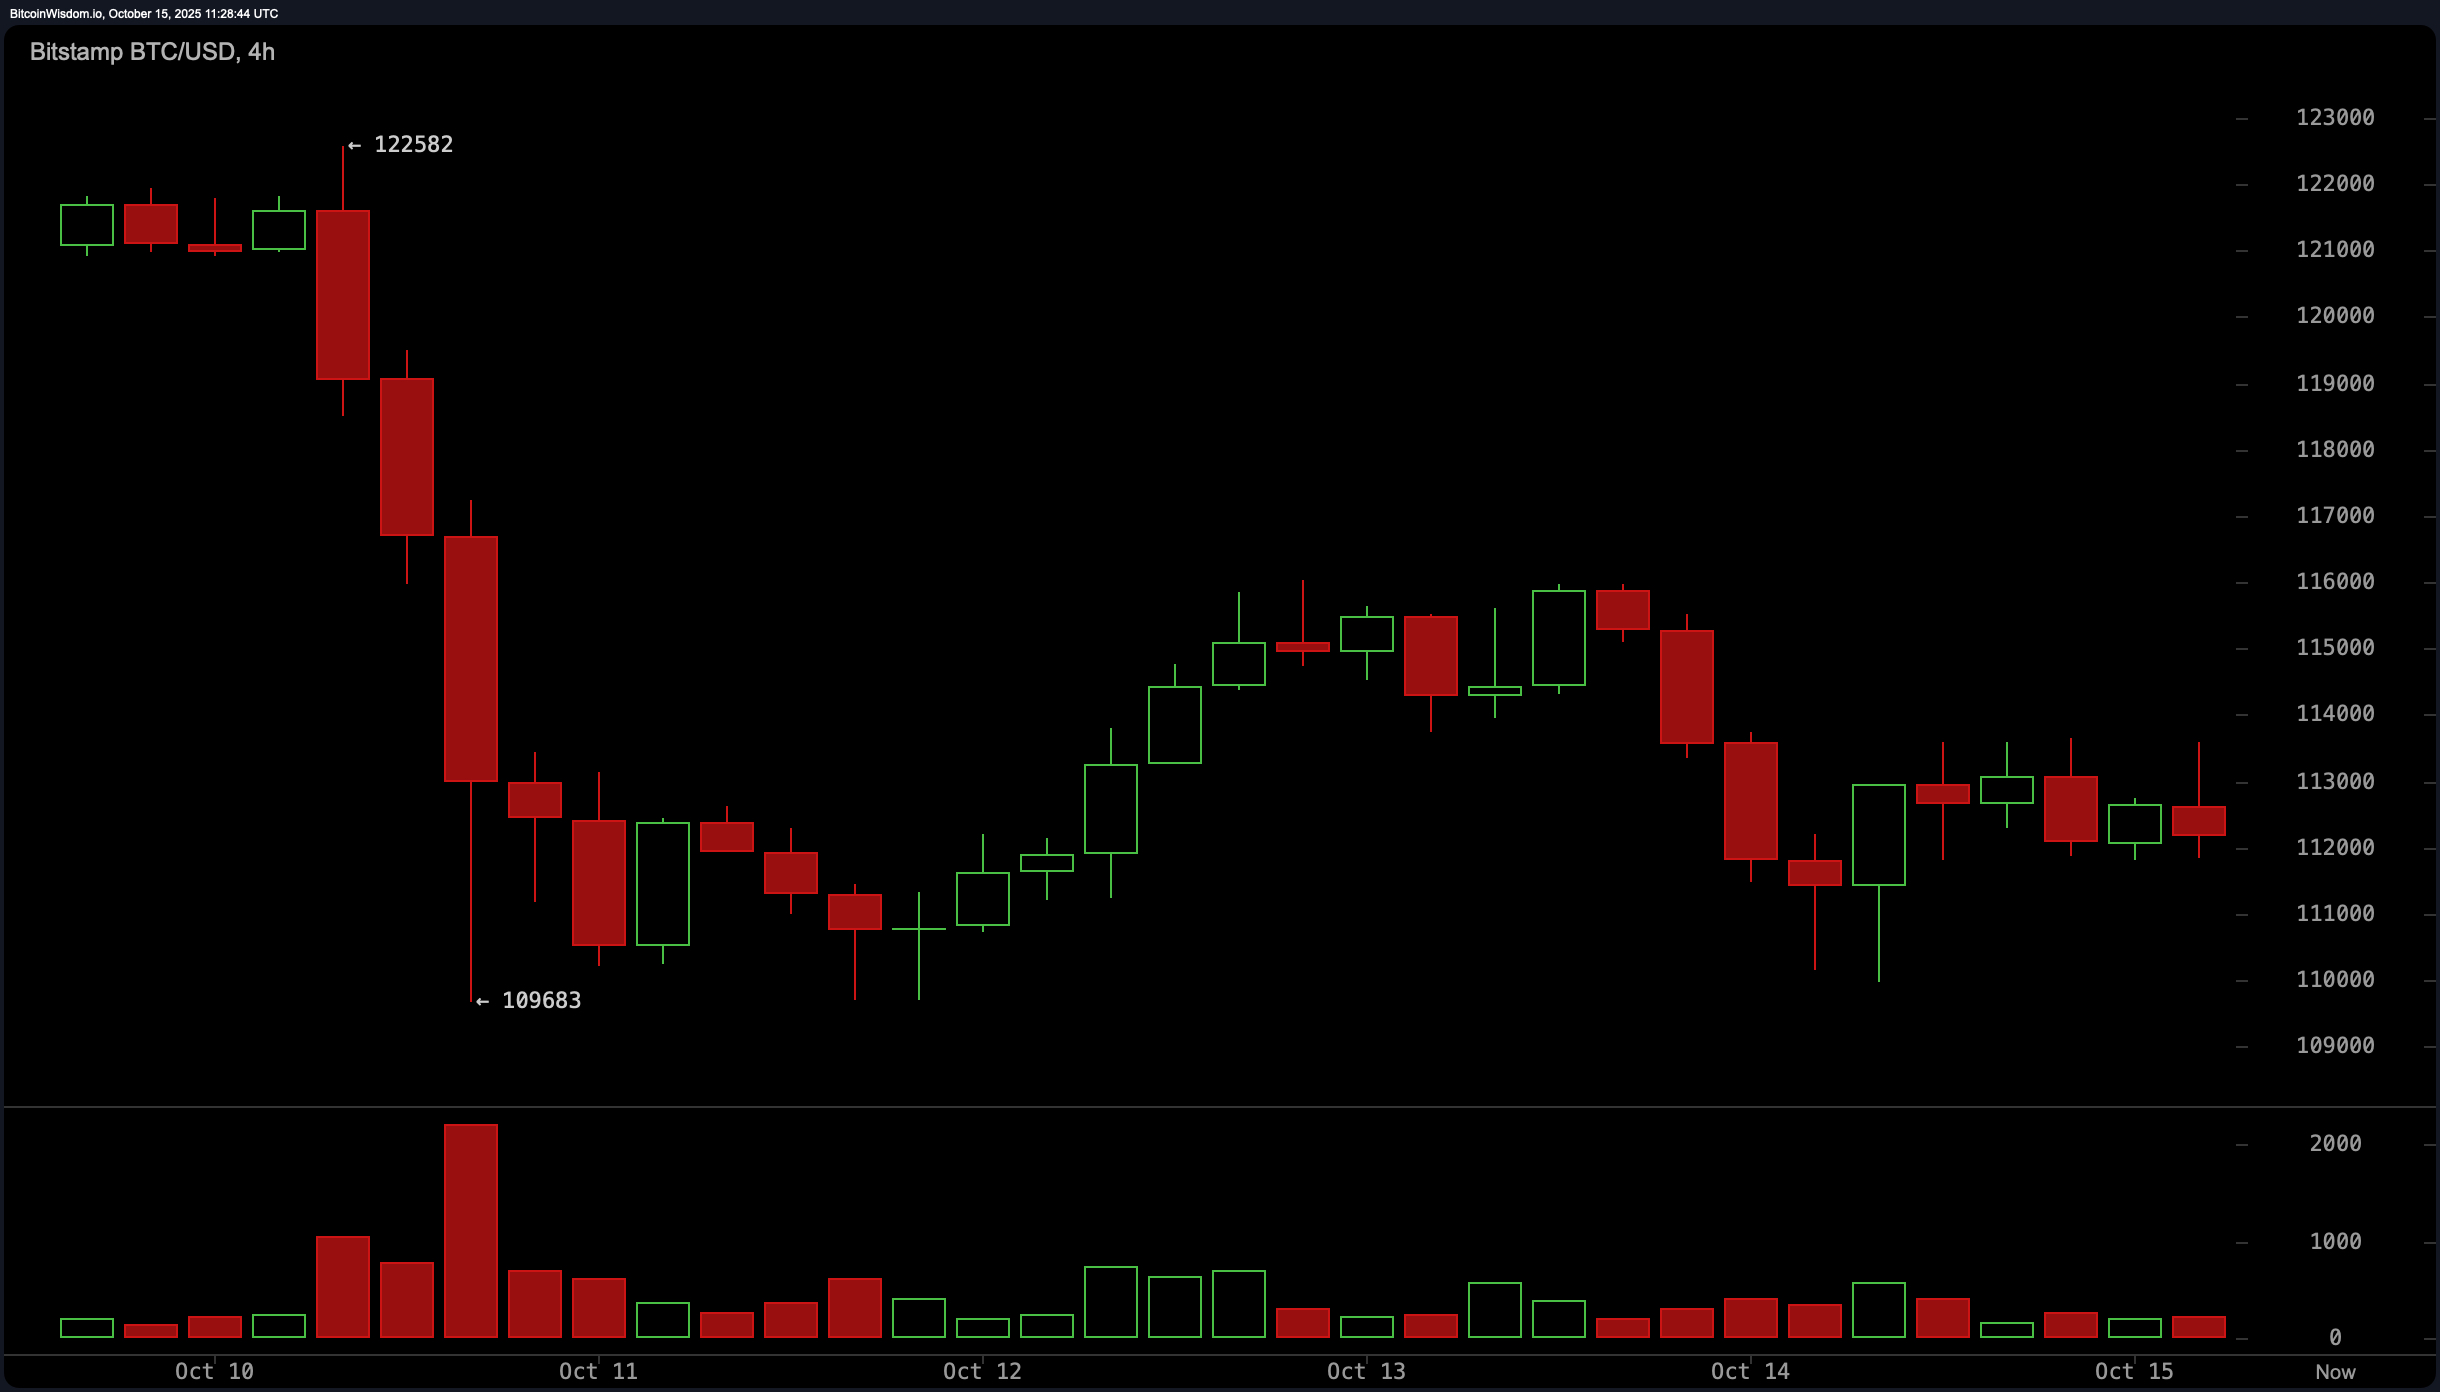
BTC/USD 4-hour chart via Bitstamp on Oct. 15, 2025.
On the 1-hour timeframe, bitcoin is tracing a micro downtrend, punctuated by lower highs and weakening volume. The $111,800 to $112,000 zone continues to serve as short-term support, while resistance remains capped at $113,400 to $113,800. The current pattern is consistent with range trading, with price compressing toward a potential breakout or breakdown. A fall below $111,500 would reinforce bearish momentum, while any bounce from support may prompt a test of nearby resistance. Traders appear cautious, with neither side showing strong initiative at present.
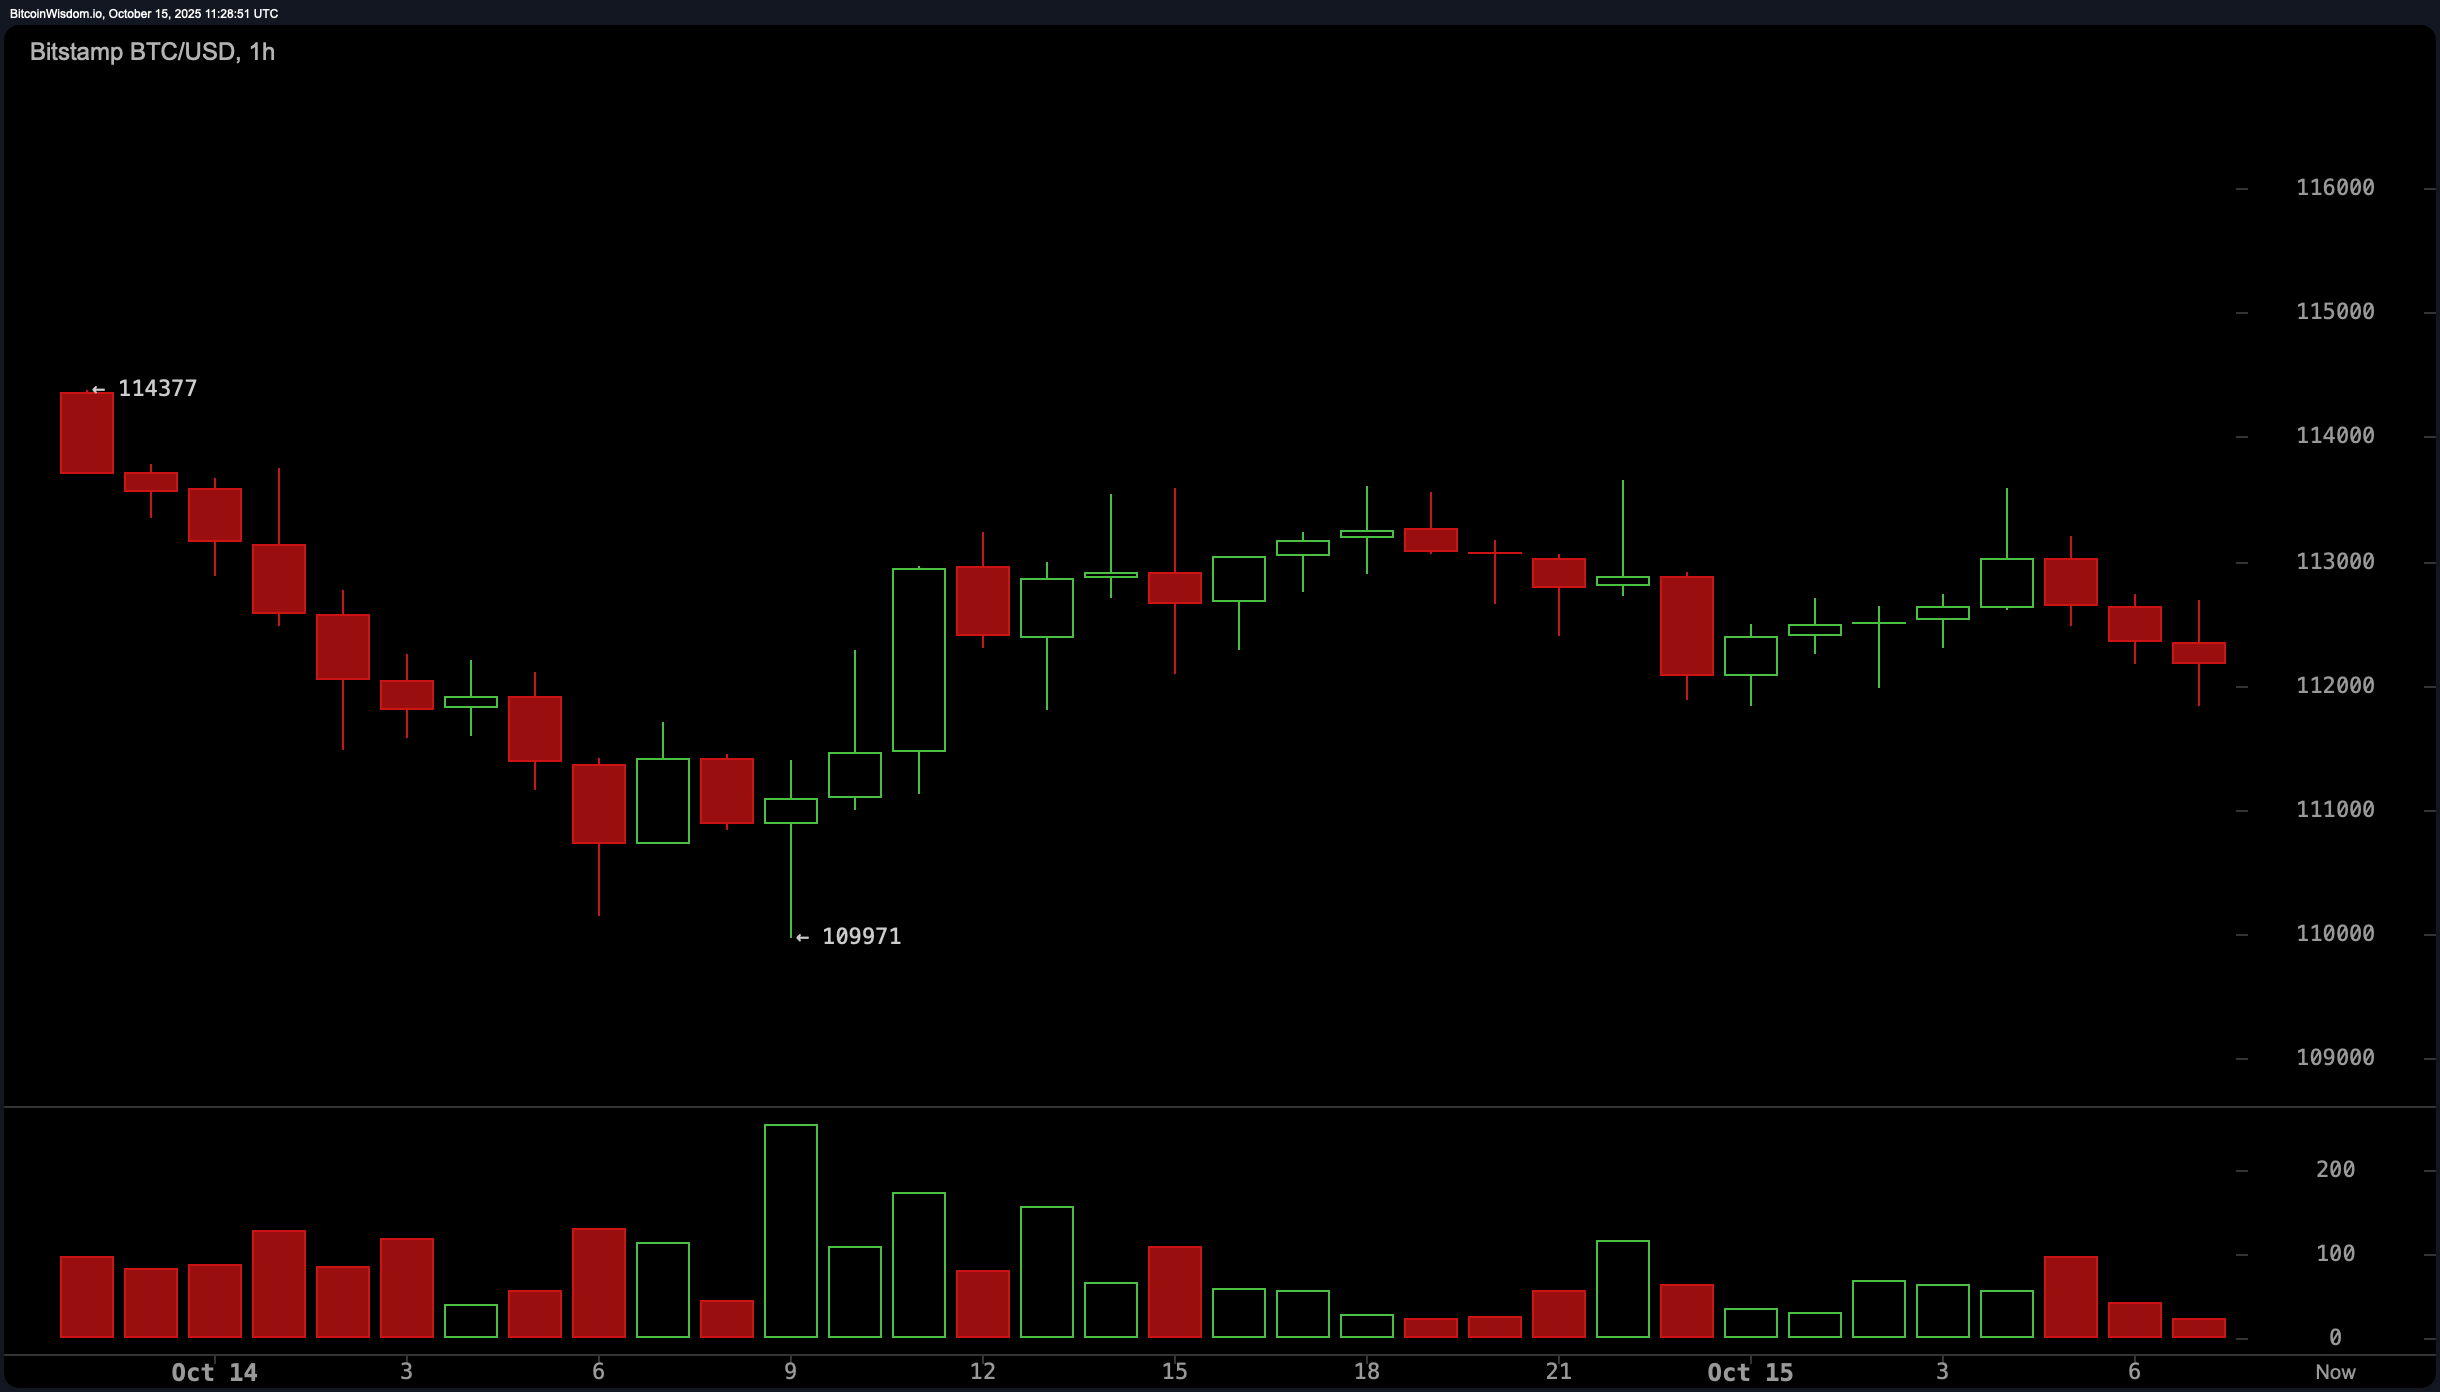
BTC/USD 1-hour chart via Bitstamp on Oct. 15, 2025.
Oscillators are leaning neutral with pockets of bearish momentum. The relative strength index (RSI) is positioned at 43, indicating neither overbought nor oversold conditions. The stochastic oscillator sits at 23, also in neutral territory, as does the commodity channel index (CCI) at −60 and the average directional index (ADX) at 25. However, the momentum indicator has fallen sharply to −11,294, and the moving average convergence divergence (MACD) is printing −254, both reflecting underlying bearish forces. The awesome oscillator echoes this sentiment with a negative reading of −3,020, reinforcing the possibility of continued weakness if price support levels break.
Moving averages (MAs) paint a consistent picture of short-term bearish alignment. The exponential moving averages (EMA) and simple moving averages (SMA) across the 10-, 20-, 30-, 50-, and 100-period ranges are uniformly trending above the current price, exerting downward pressure. The only exceptions are the 200-period EMA and SMA, at $108,105 and $107,286, respectively, both positioned below the spot price and still reflecting a longer-term upward trend. This divergence highlights the contrast between a potentially corrective phase in the short term and structural strength on higher timeframes. For now, price action remains range-bound with bearish undertones, as the market awaits a clearer directional catalyst.
Bull Verdict:
If bitcoin maintains support above $111,800 and buyers reclaim ground above $114,800 with conviction, the technical structure could pivot in favor of a short-term recovery. A sustained break above the $115,000–$117,000 zone would invalidate the bearish formations and potentially reestablish upward momentum toward prior highs.
Bear Verdict:
Should bitcoin breach the $111,500 support with volume, the prevailing bear flag structure suggests a continuation lower, with $109,000 and $108,000 as immediate downside targets. The alignment of momentum indicators and moving averages reinforces a short-term bearish bias unless significant buying pressure emerges above resistance.
FAQ 🧭
What is bitcoin’s current price?
Bitcoin is trading at $112,121 as of October 15, 2025.
What is bitcoin’s intraday trading range today?
The price fluctuated between $110,456 and $113,537 in the past 24 hours.
Is bitcoin in a bullish or bearish trend?
Technical indicators show a short-term bearish trend with weak upward momentum.
What support and resistance levels are key right now?
Key support is at $111,500, while resistance stands at $114,800.