
Bitcoin is trading at $105,579 to $106,377 over the last 60 minutes, with a total market capitalization of $2.08 trillion. Over the past 24 hours, bitcoin recorded a trading volume of $101.17 billion and moved within an intraday price range of $103,530 to $112,012.
Bitcoin Chart Outlook
The 1-hour chart reveals a clear breakdown from the $112,000 level, with strong selling momentum dominating recent sessions. While a brief period of sideways consolidation has emerged near the $103,000 level, the price action remains highly reactive to sell-side pressure.
Volume analysis suggests a potential climax, as the last hourly candle displays a lower wick and a green body—early signs of short-term buying interest. However, without confirmation through structure or volume, this could simply be a relief pause in a broader decline. Scalping opportunities may exist within the $103,000 to $106,000 range, though the risk of false breakouts remains elevated.
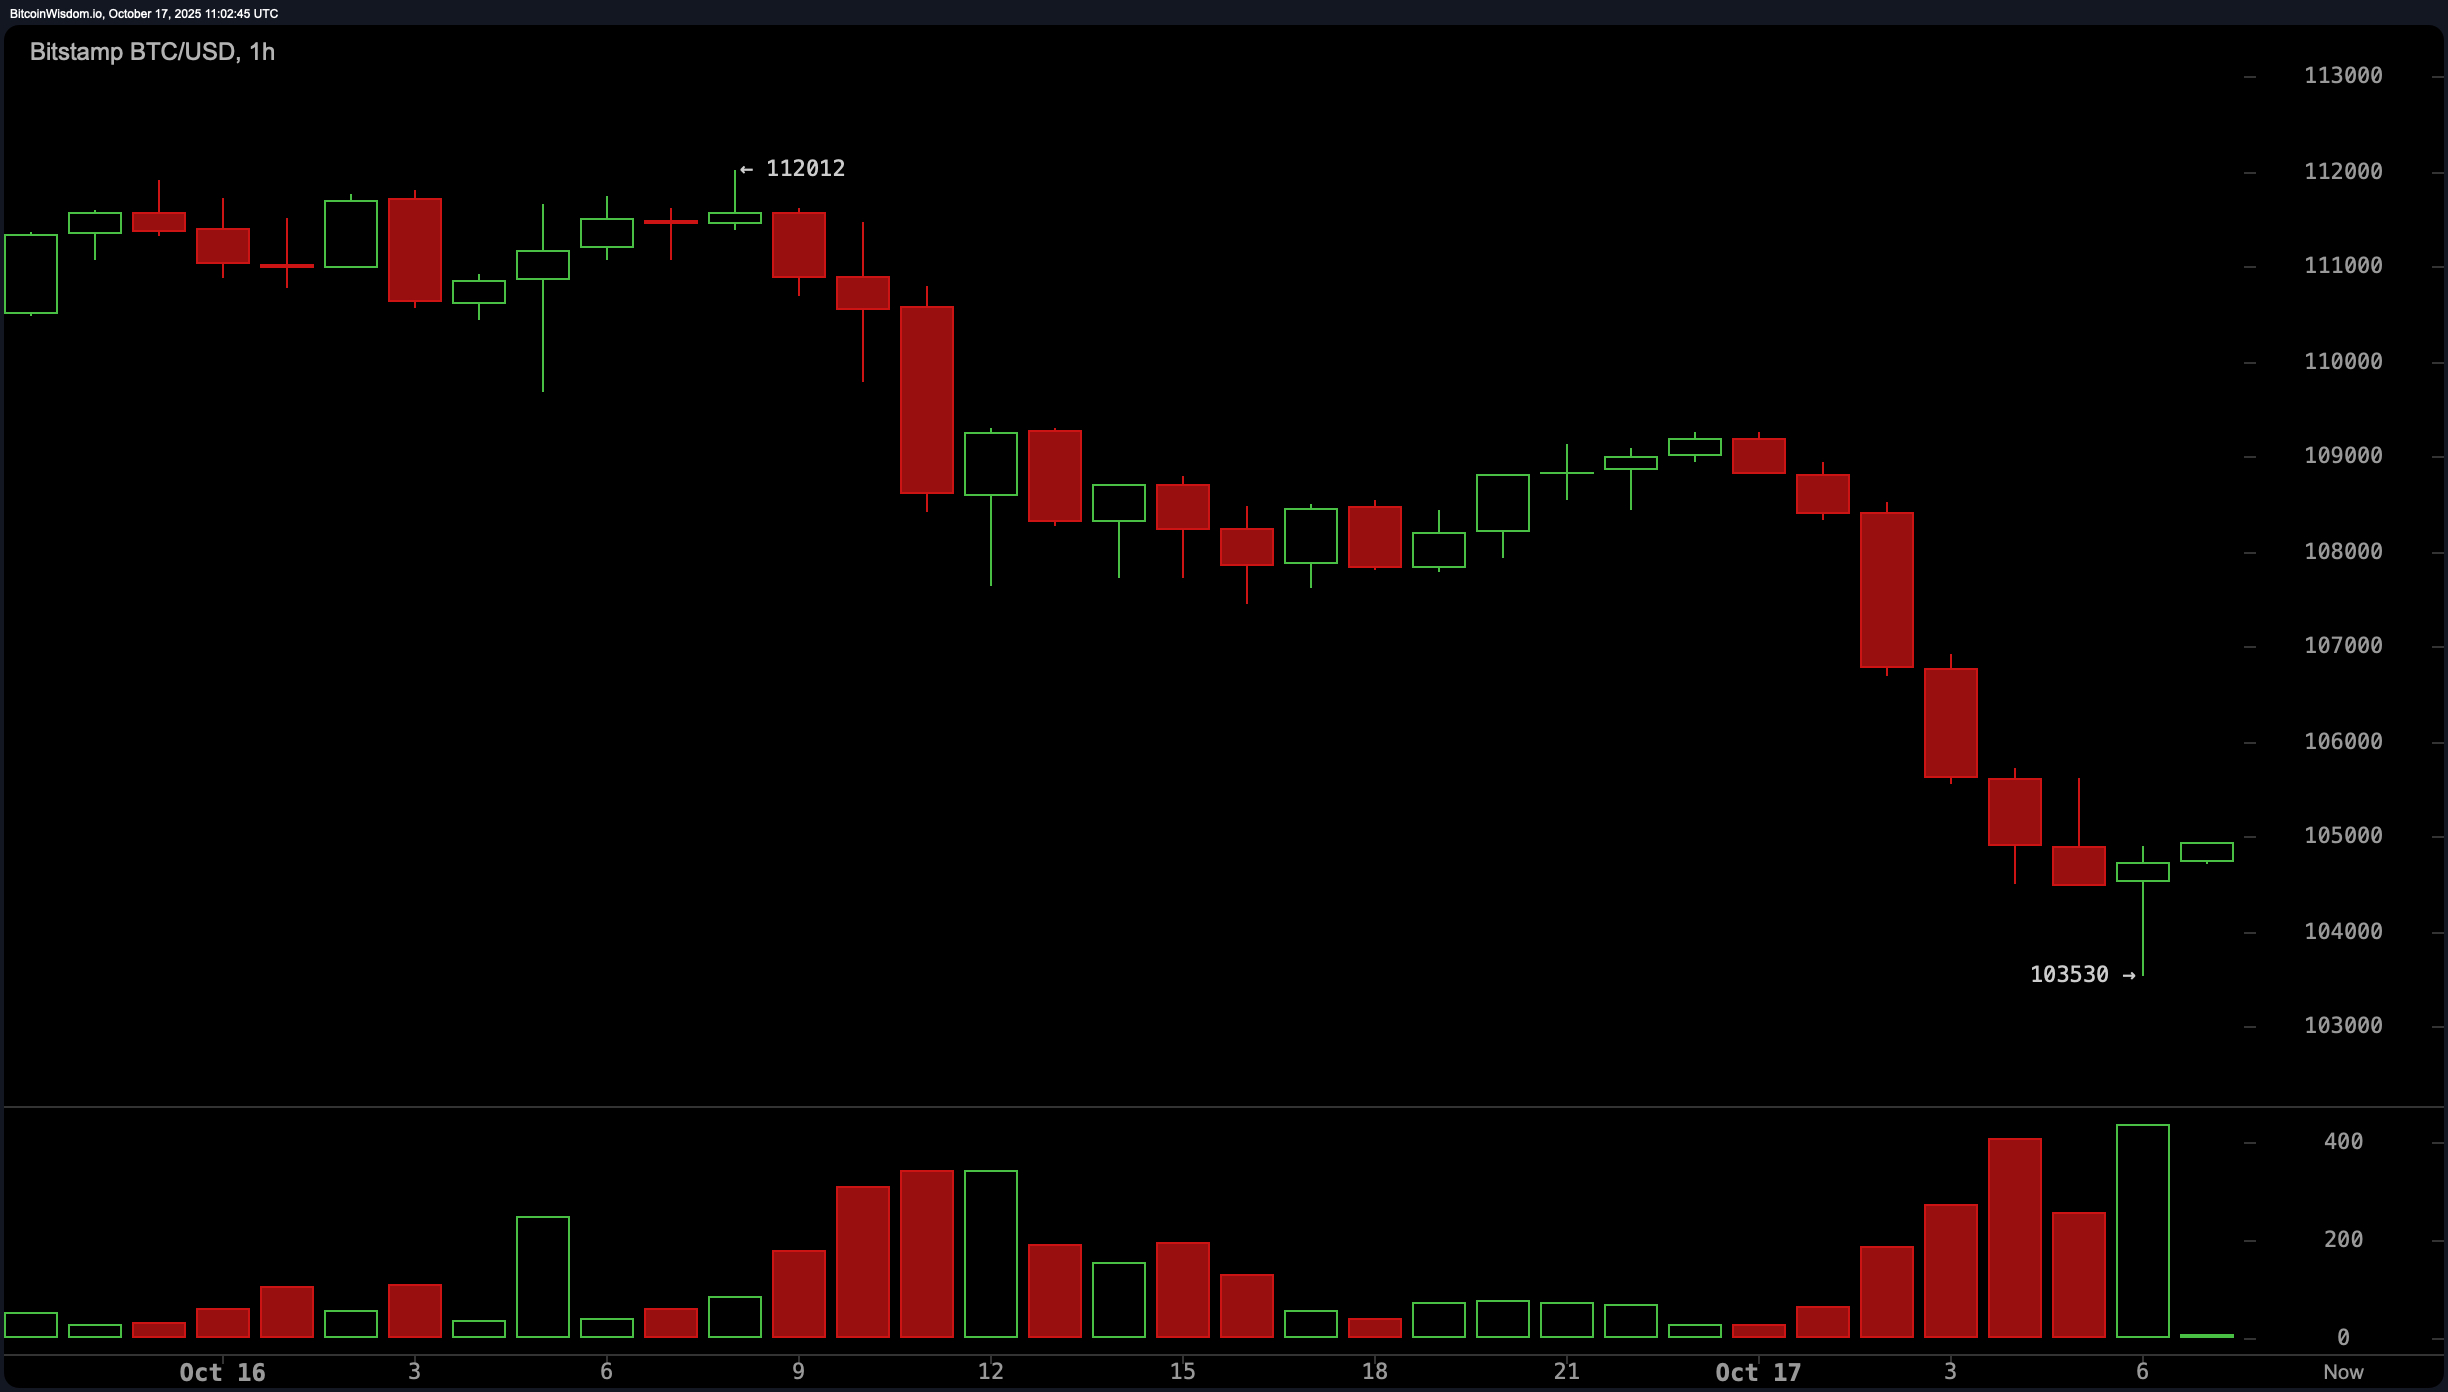
BTC/USD 1-hour chart via Bitstamp on Oct. 17, 2025.
The 4-hour chart corroborates the bearish narrative, highlighting a sequence of lower highs and lower lows since bitcoin’s recent high of $116,035. Sustained sell volume and the aggressive breakdown through support zones illustrate market-wide risk aversion. The price briefly wicked below $103,000 before rebounding slightly, hinting at a potential demand pocket. Resistance appears firm near $108,000, with momentum indicators favoring continued caution. A double-bottom formation or bullish divergence would be required to validate any upward shift in momentum at this timeframe.
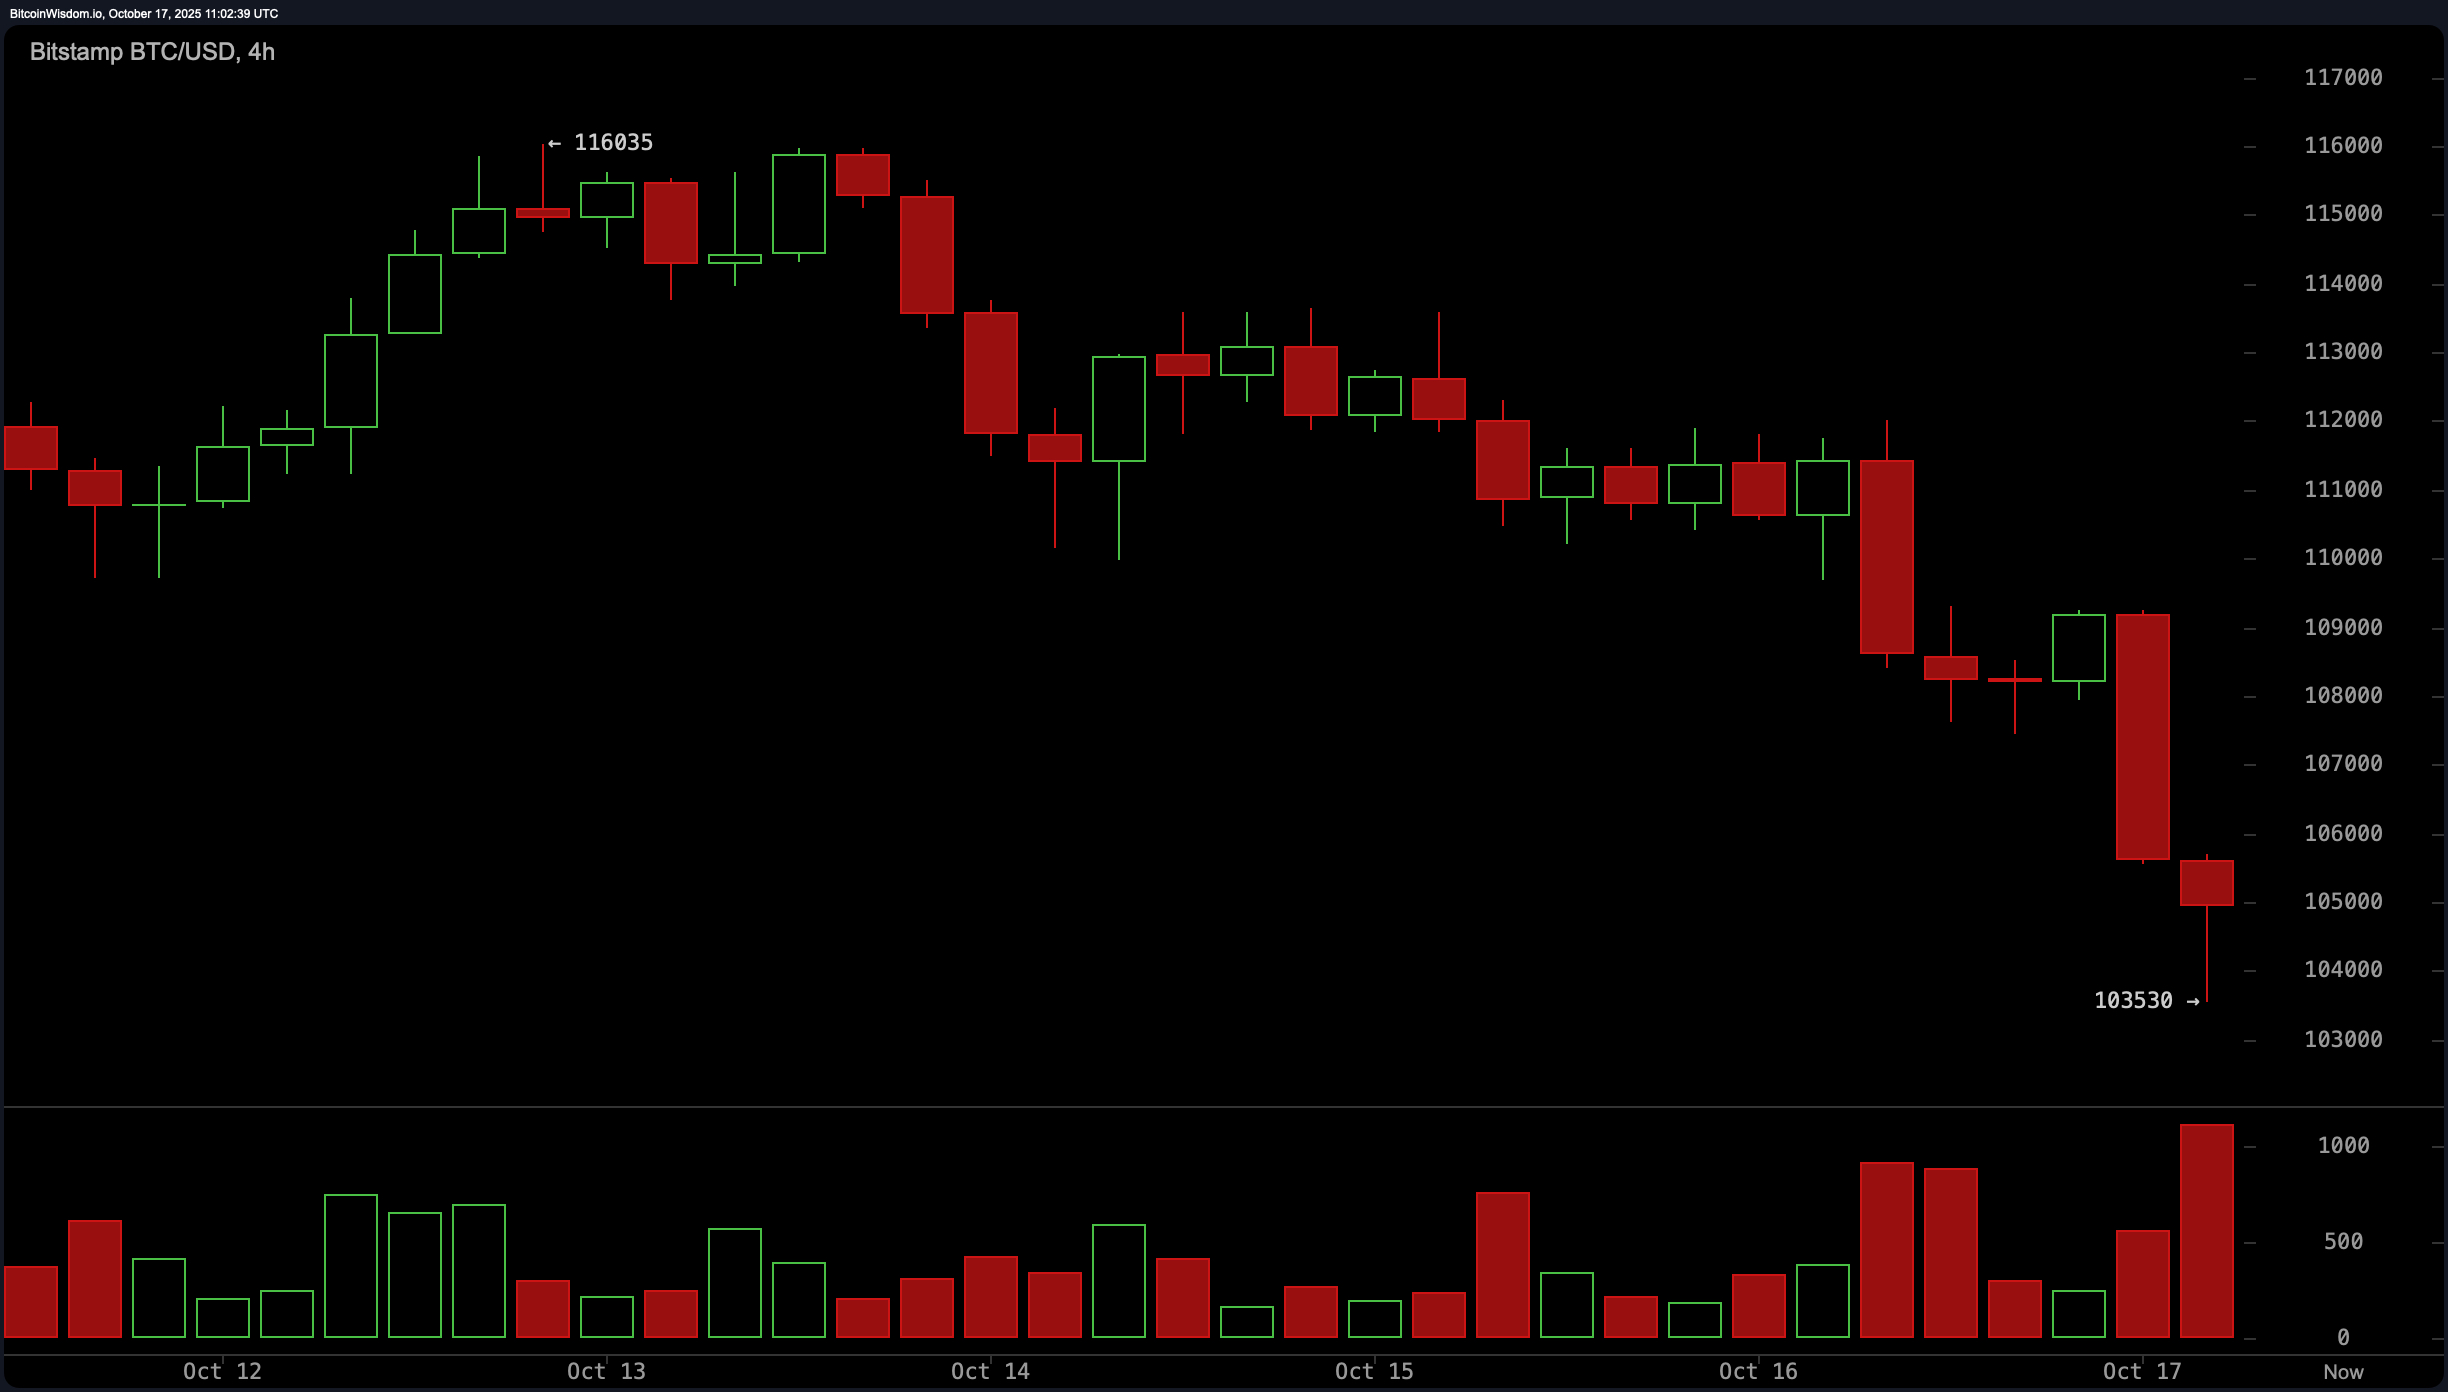
BTC/USD 4-hour chart via Bitstamp on Oct. 17, 2025.
From a daily chart perspective, bitcoin recently reversed sharply after peaking at $126,272. Large red candlesticks on significant volume underscore institutional selling or panic-induced exits. The most recent drop toward $103,530 places bitcoin at a major support level, with $100,000 representing the next psychological floor. Despite short-term volatility, the overall structure remains fragile. Key resistance zones reside between $124,000 and $126,000, where prior rejection was forcefully established.
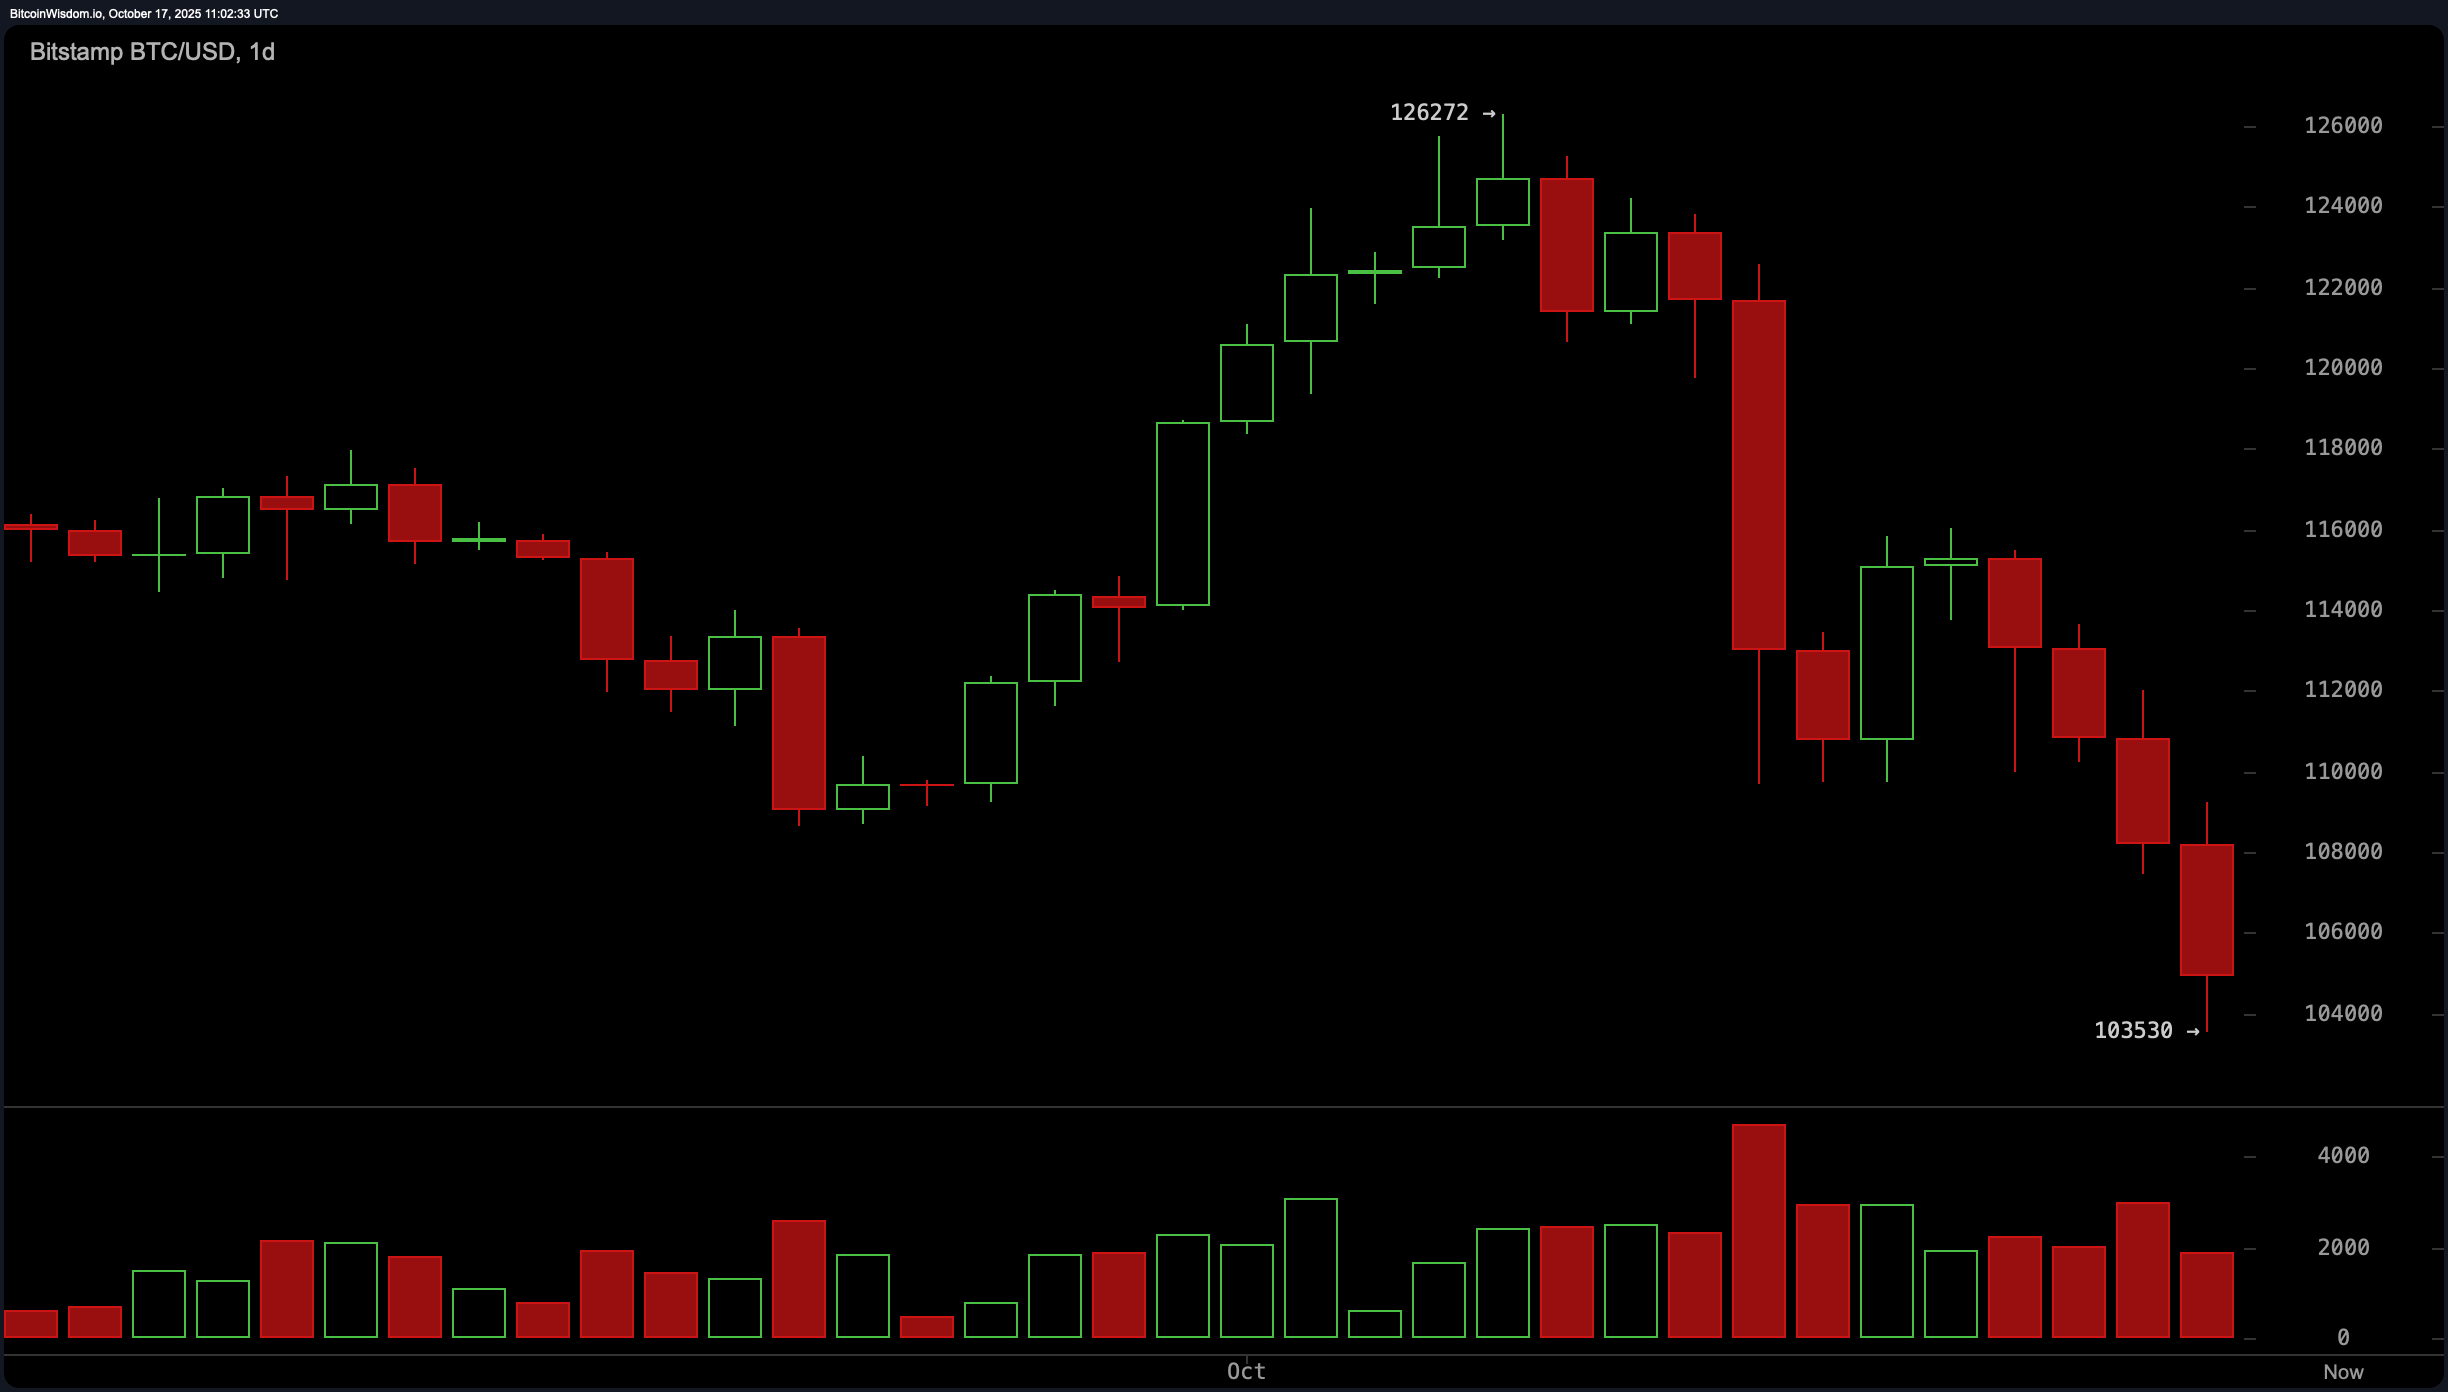
BTC/USD daily chart via Bitstamp on Oct. 17, 2025.
Oscillator readings reflect a largely neutral sentiment with an underlying bearish tilt. The relative strength index (RSI) is at 33, suggesting nearing oversold territory without a clear reversal. Stochastic oscillators stand at 6, and the commodity channel index (CCI) is deeply negative at -146. Meanwhile, the average directional index (ADX) at 26 confirms the presence of a strong trend. The awesome oscillator shows a negative value of -4,350, aligning with the current downward momentum, while both momentum and the moving average convergence divergence (MACD) indicate further downside with values of -16,527 and -1,627, respectively.
Moving averages paint a uniform picture of bearish pressure. Every key exponential moving average (EMA) and simple moving average (SMA) from the 10-period to the 200-period shows action consistent with downward continuation. The 10-period EMA and SMA are currently at $112,317 and $113,607, well above current prices, suggesting resistance on any potential bounce. Longer-term averages such as the 200-period EMA at $108,060 and the 200-period SMA at $107,520 have also turned downward, reinforcing the sustained bearish trend across all time horizons.
Bull Verdict:
Despite the prevailing downtrend, bitcoin has approached a key support zone near $103,000 with signs of possible capitulation. If this level holds and volume shifts to the buy side, a short-term rebound toward $108,000–$110,000 is plausible. Confirmation through a bullish pattern or volume reversal would be essential to validate this view.
Bear Verdict:
The technical landscape for bitcoin remains decisively bearish across all timeframes, with consistent lower highs, heavy selling volume, and widespread rejection at moving average resistance levels. Without a structural reversal or significant shift in momentum, further downside toward $100,000 or lower remains the dominant scenario.
FAQ
What is bitcoin’s current price? Bitcoin is trading at $105,579 to $106,377 as of October 17, 2025, at 7:30 a.m. EST.
What price levels are critical for bitcoin now?Key support is near $103,000, with resistance around $108,000–$110,000.
Is bitcoin in a bullish or bearish trend?Technical indicators show a strongly bearish trend across all timeframes.
What do trading volumes suggest about market sentiment?Elevated selling volume signals caution, though signs of capitulation are emerging.