Following a tumultuous February that saw Bitcoin plummet from the mid-$90,000 range to a low of $59,000, there is finally some optimism in the market. Currently, $BTC has surged approximately 4.65%, trading around $71,013 and alleviating some of the anxiety that has prevailed over recent weeks.
However, this upward movement has created a familiar pattern on Bitcoin’s charts—one that raises concerns about a potential price decline.
The broader financial landscape remains cautious. Stock markets have hit four-month lows following reports of delays regarding possible U.S.-Iran military actions, causing cryptocurrencies to move in tandem with equities during this mild risk-on phase. Additionally, WTI crude oil prices have seen significant drops while the crypto sector finds itself once again in “extreme fear” territory according to the Crypto Fear and Greed Index.
Nonetheless, certain Bitcoin enthusiasts argue that now might be an opportune moment for investment since similar spikes occurred earlier this month. So who holds the right perspective? Let’s analyze what the charts reveal:
Bitcoin ($BTC) Price Analysis: The Numbers
This week is off to a promising start for Bitcoin: it experienced a 4.6% increase from $67,844 to reach a daily peak of $71,811 before stabilizing at around $70,985. This fluctuation aims to breach resistance established by its average price over the past 200 days—a crucial test for trend strength.
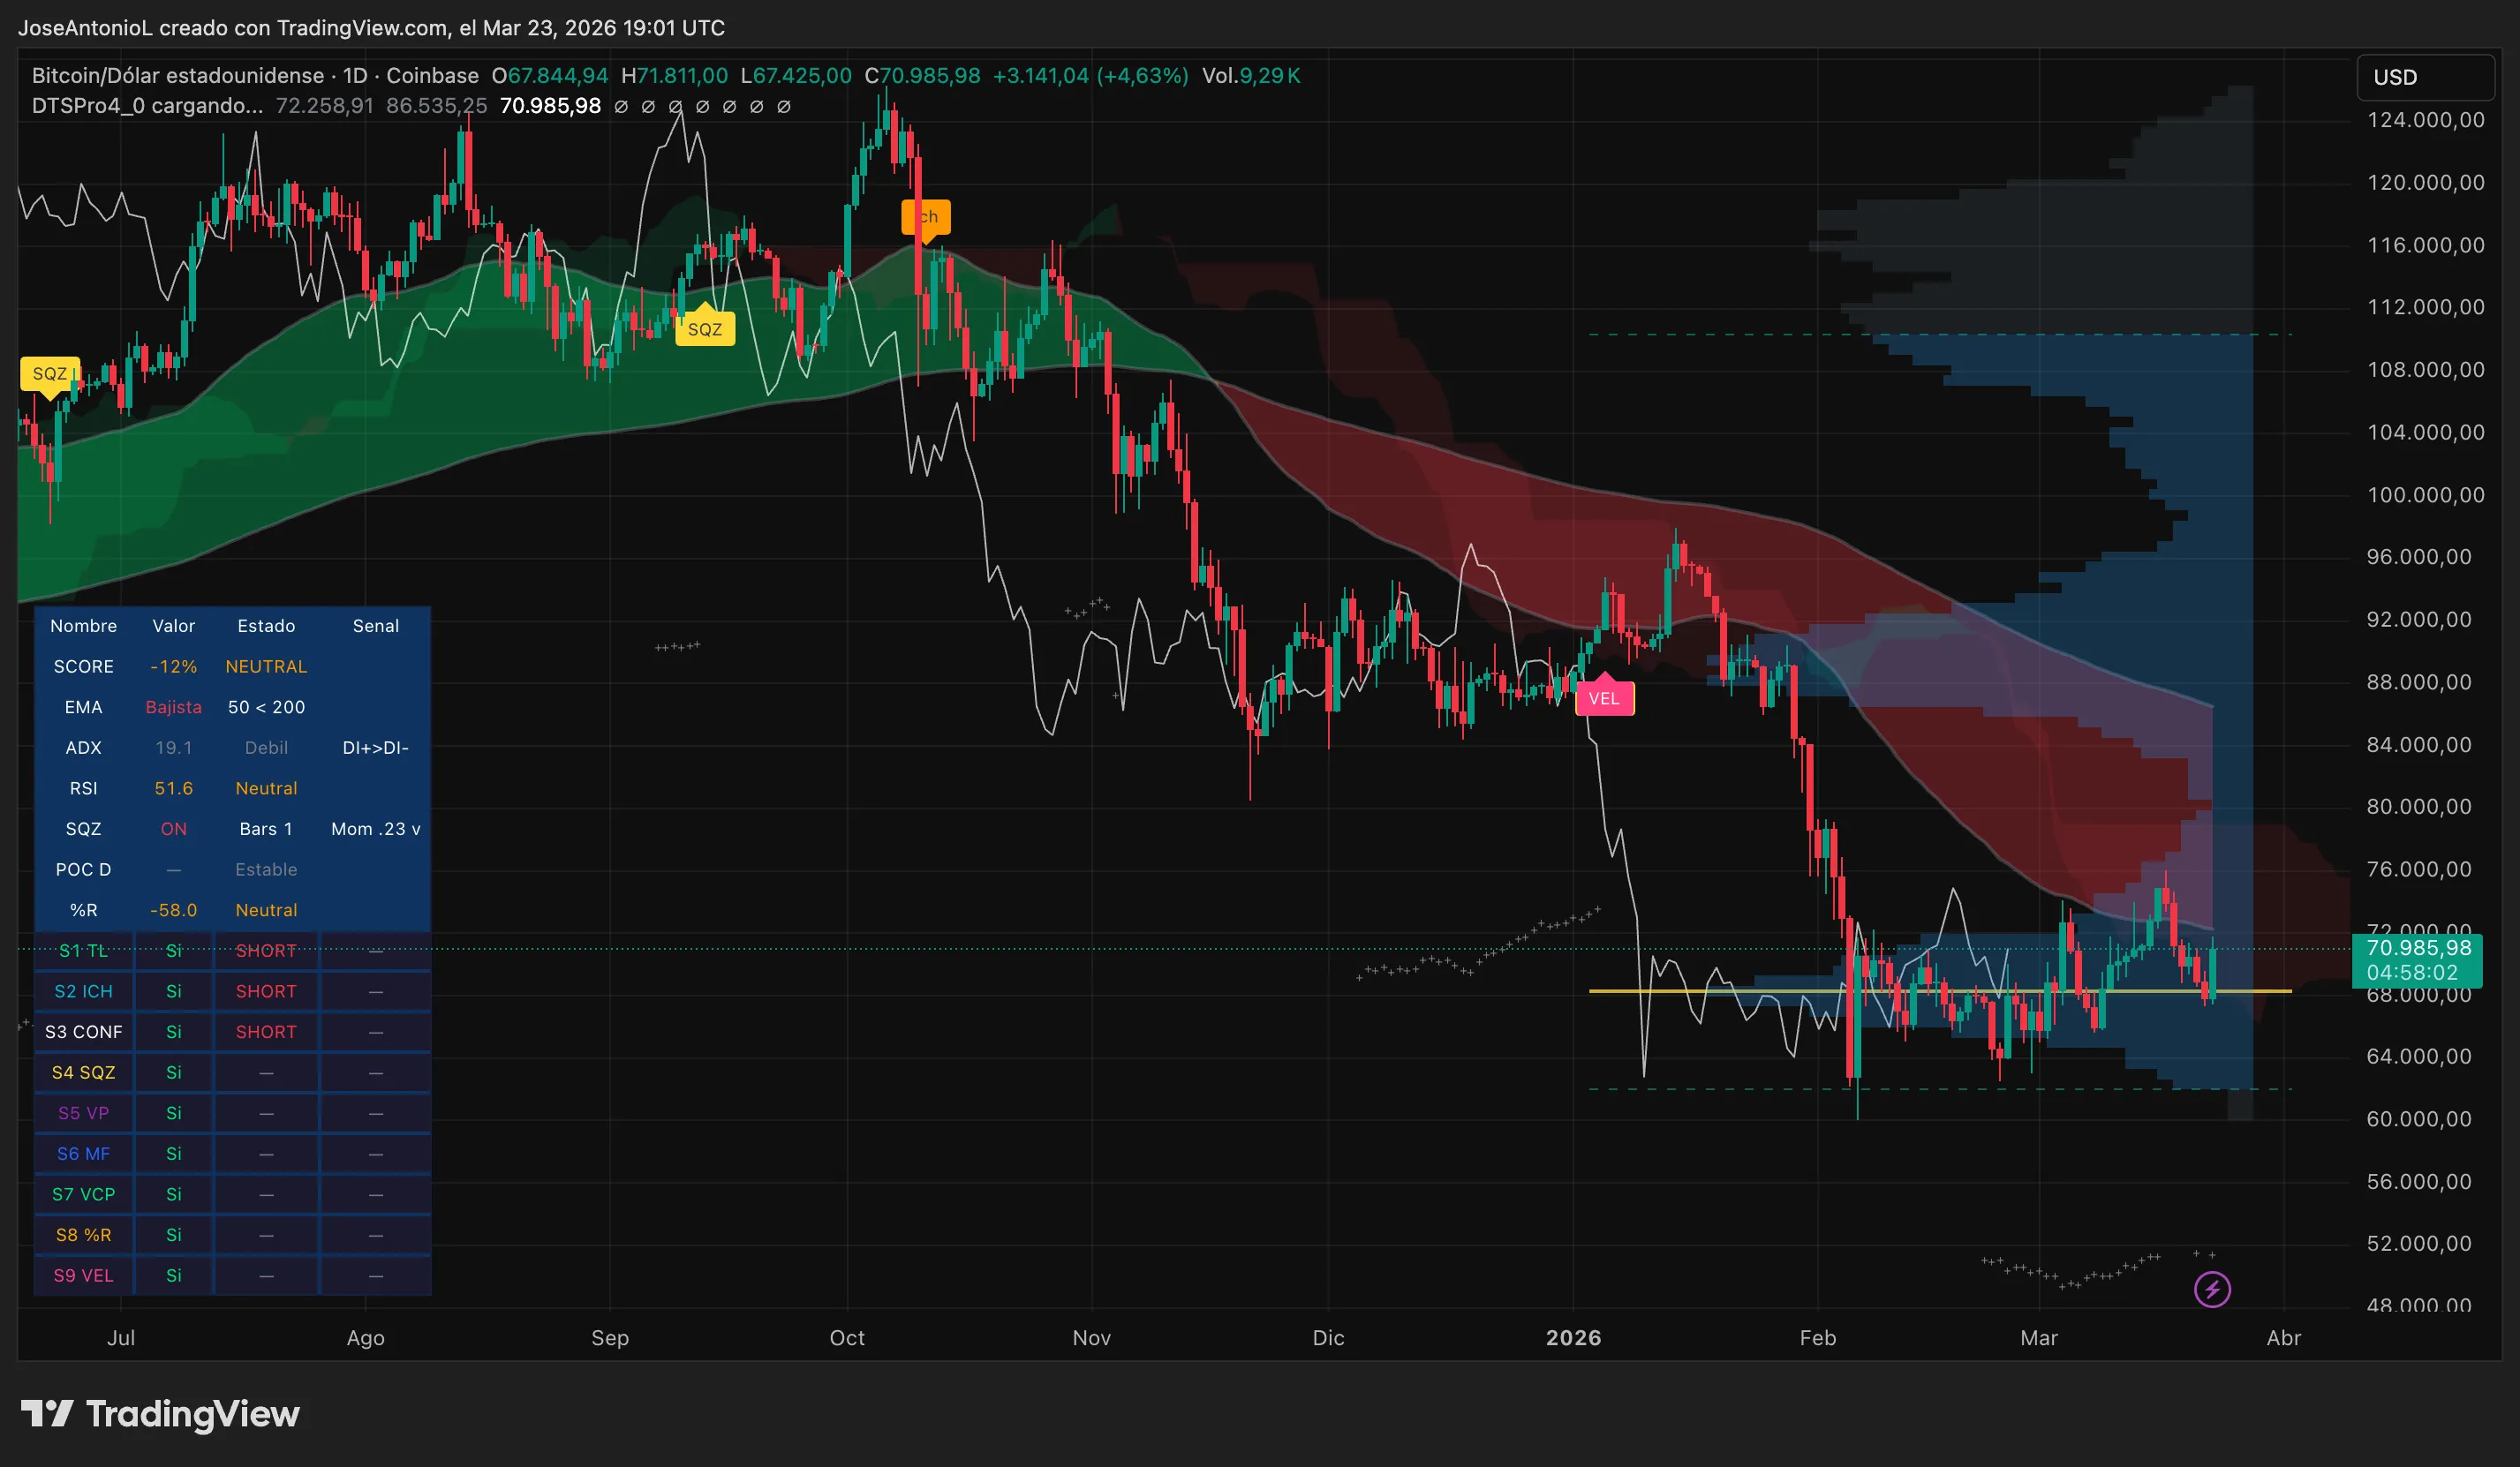
Bitcoin price data. Image: Tradingview
A closer examination reveals more complexity beneath these numbers. The Average Directional Index (ADX), which gauges trend strength stands at 19.1—below 25—the threshold traders consider indicative of genuine momentum behind any trend shift; thus suggesting weakening trends where bears are struggling against ongoing downward pressure.
The exponential moving averages (EMAs) echo this sentiment as well; currently showing that the 50-day EMA remains below its 200-day counterpart—a clear signal interpreted by traders as bearish sentiment prevailing overall even amidst temporary rebounds.
The Relative Strength Index (RSI) sits neutral at 51.5—not signaling either buy or sell conditions—which aligns with current market dynamics indicating it’s too early for celebration or panic just yet.
The Squeeze Momentum Indicator shows momentum at only modest levels—currently reading just above zero—indicating potential energy build-up prior towards significant movement but lacking directionality so far amidst low momentum readings.
Fool Me Once…
This moment feels different than typical bounces because it reflects patterns previously observed twice before—with both instances resulting unfavorably for investors involved!
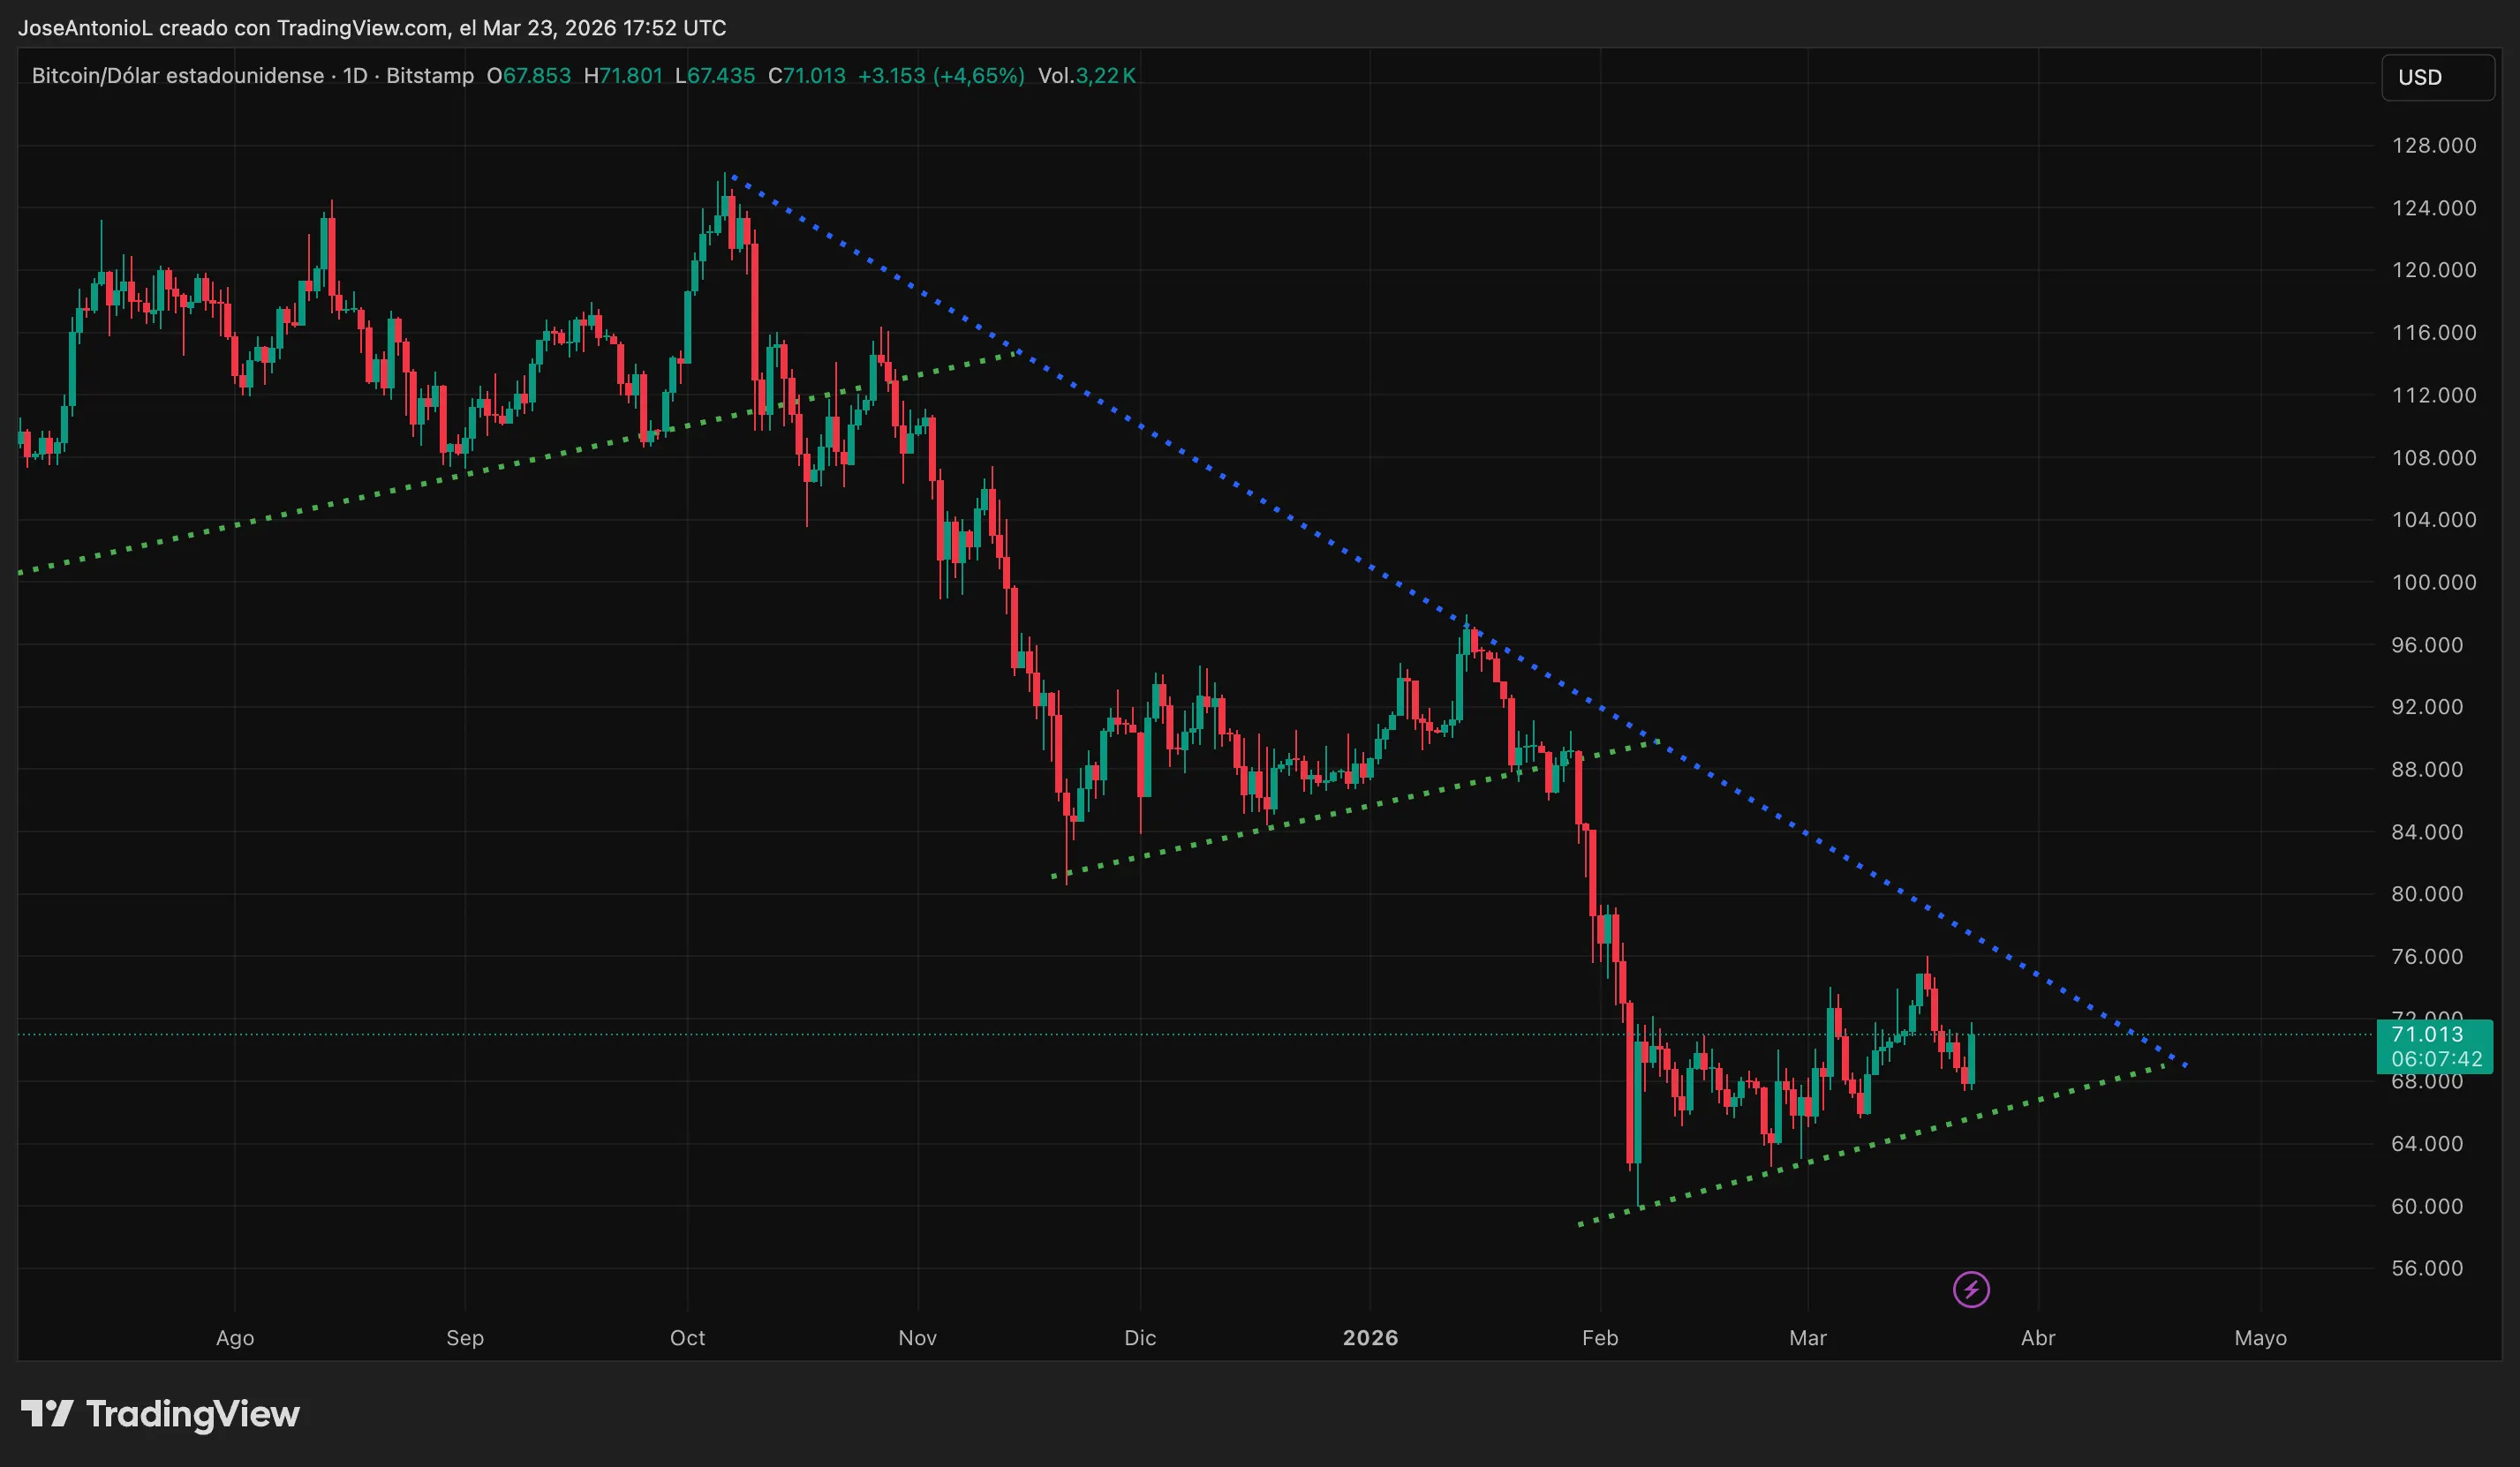
Bitcoin price data. Image: Tradingview
A blue descending resistance line stretches back from Bitcoin’s October peak near $125K down through current pricing levels—it acts like an overhead ceiling preventing further advances upwards (hence termed ‘resistance’). Below lies three parallel green dotted ascending lines representing support levels; after major downturns historically followed by compressions leading up towards these resistances until eventual breakdowns occur thereafter when pressures mount too high!
- This pattern repeated post-October crash when recovery led into same wedge structure only later breaking down sharply one month after touching said resistance line!
- A similar situation unfolded again following January’s downturn leading directly into February’s wipeout downwards toward lows around fifty-nine thousand dollars ($59K).
- Currently forming identical structures once more! With ascending support acting as floor while descending blue ceiling looms closely overhead near seventy thousand dollars ($70K)—if history serves correctly we could see another rejection emerge come April-May timeframe next year…
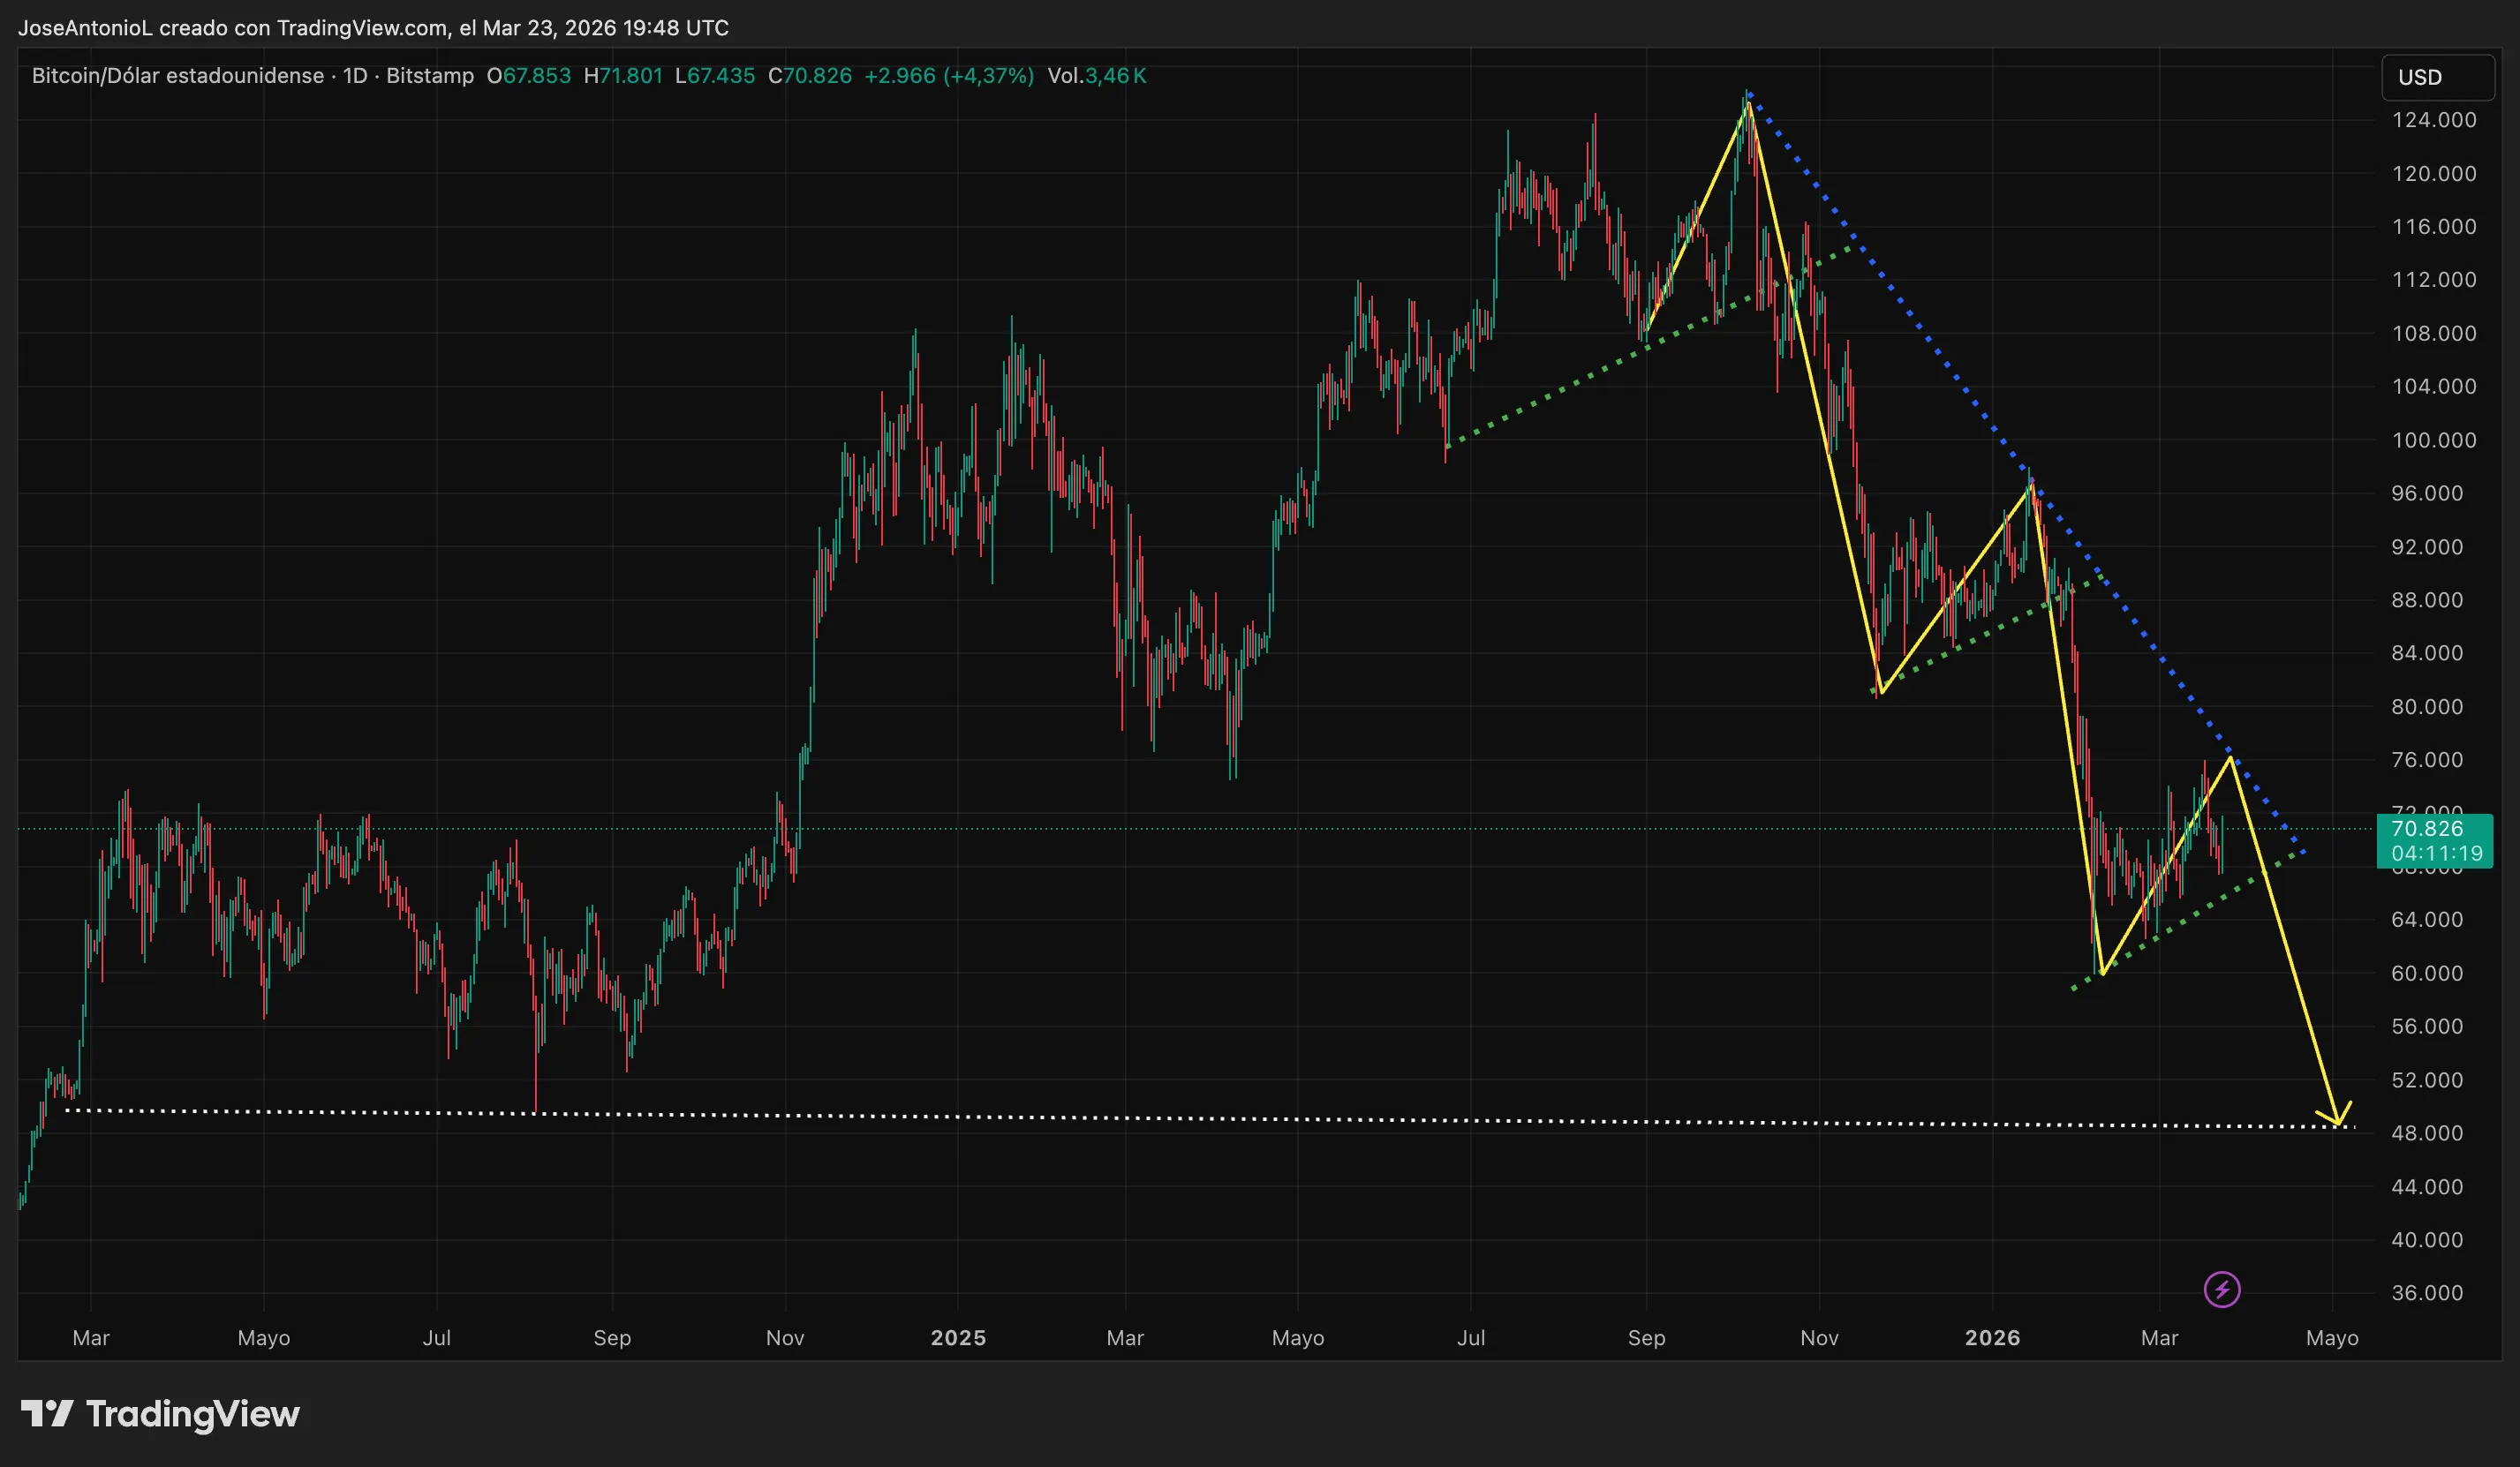
Bitcoin price data.Image: Tradingview
