
Bitcoin is currently revisiting a pivotal level that may influence its forthcoming significant movements. As the price action returns to a previously debated support and resistance area, focus is now directed towards specific upside targets that could materialize if this level remains intact.
Bitcoin’s S/R Zone Retest Indicates Market Strength
Market analyst Johnathan Carter notes that Bitcoin’s weekly chart is reexamining an essential zone that once served as resistance before being surpassed. This same level has now transitioned into support, illustrating a classic flip between support and resistance.
The chart shared by Carter reveals that Bitcoin’s price has retraced into this zone following a robust upward surge, with buyers stepping in to uphold it. This reaction isn’t coincidental; the highlighted region around the mid-$60,000 range corresponds with an earlier breakout point, emphasizing its technical significance.
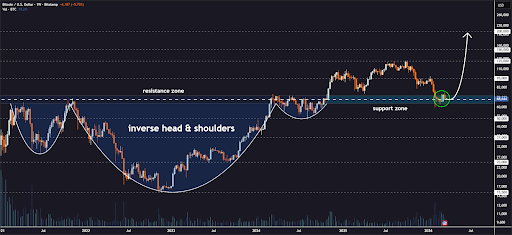
The analyst emphasizes that this retest serves as structural validation. The bulls’ ability to keep prices above this threshold indicates the breakout remains legitimate and suggests the overarching upward trend continues unabated.
Additionally, there exists a prominent inverse head and shoulders pattern on the weekly timeframe which signifies a shift from bearish to bullish dominance.
The neckline of this formation closely aligns with the current S/R zone, enhancing the importance of the ongoing retest. After breaking through this neckline, Bitcoin experienced significant gains before retreating for another test. The chart also depicts a rounded retest structure indicating controlled pullbacks—this kind of price movement often signals accumulation where buyers gradually regain control without pushing prices lower.
Four Significant Price Targets Emerge
With support holding firm and constructive developments in progress during this retest phase, attention turns toward potential price targets identified by analysts. The first key level to watch is $95,000—a near-term resistance area based on recent pricing patterns. A move into this territory would affirm continuation from its current base.
The next target beyond $95,000 stands at $125,000; it correlates with an earlier consolidation range observed during Bitcoin’s previous rally phase. Surpassing this mark would indicate sustained bullish momentum moving forward. Following closely is $150,000—a psychological milestone reflecting an extension of prevailing trends where market participation typically intensifies as momentum builds up further.
Lastly, there lies a long-term goal set at $200,000 representing full realization of projected movements post-inverse head and shoulders breakout as illustrated by trajectory patterns on charts.
The present pricing behavior implies confirmation of breakouts within markets; buyers are actively defending tested zones without any evident breakdowns in structure thus maintaining bullish frameworks intact—so long as these supports endure—the pathway towards elevated levels stays open keeping all four targets—$95K,$125K,$150K,and$200K—in clear sight!
Featured image created with Dall.E; chart sourced from Tradingview.com