Bitcoin is currently stabilizing within a specific range, maintaining its position above crucial support levels while striving to gain momentum. However, the market remains relatively subdued as both buyers and sellers exercise caution, leading to a period of anticipation for new trading activity.
Technical Overview
By Shayan
Daily Chart Analysis
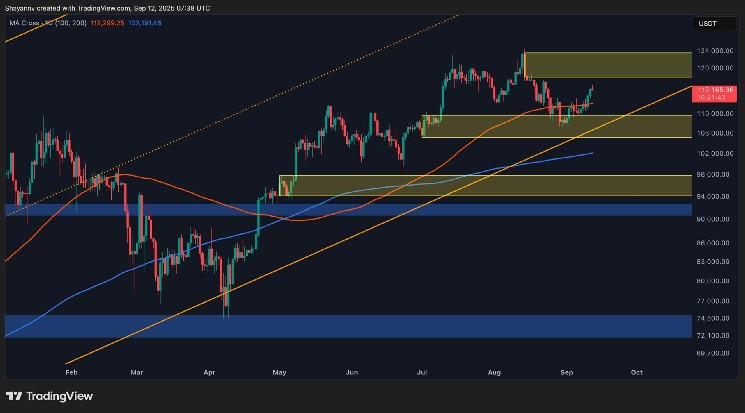
The daily chart indicates that Bitcoin is sustaining its position above the decision point (DP) between $107K and $110K, which has served as a foundation for its recent upward movement. The next target for this asset appears to be the liquidity zone just beneath the all-time high of $124K, where previous selling pressure may re-emerge.
The overall bullish trend remains strong, bolstered by an ascending long-term trendline along with the 100-day and 200-day moving averages. Nevertheless, the presence of small candlesticks suggests a lack of vigorous buying interest, indicating that if momentum diminishes further, there could be potential pullbacks in price.
A consistent close above $118K–$120K would signal renewed strength in Bitcoin’s price action and pave the way for another attempt at reaching an all-time high. Conversely, any rejection at these levels might lead Bitcoin back toward support around $110K.
4-Hour Chart Insights
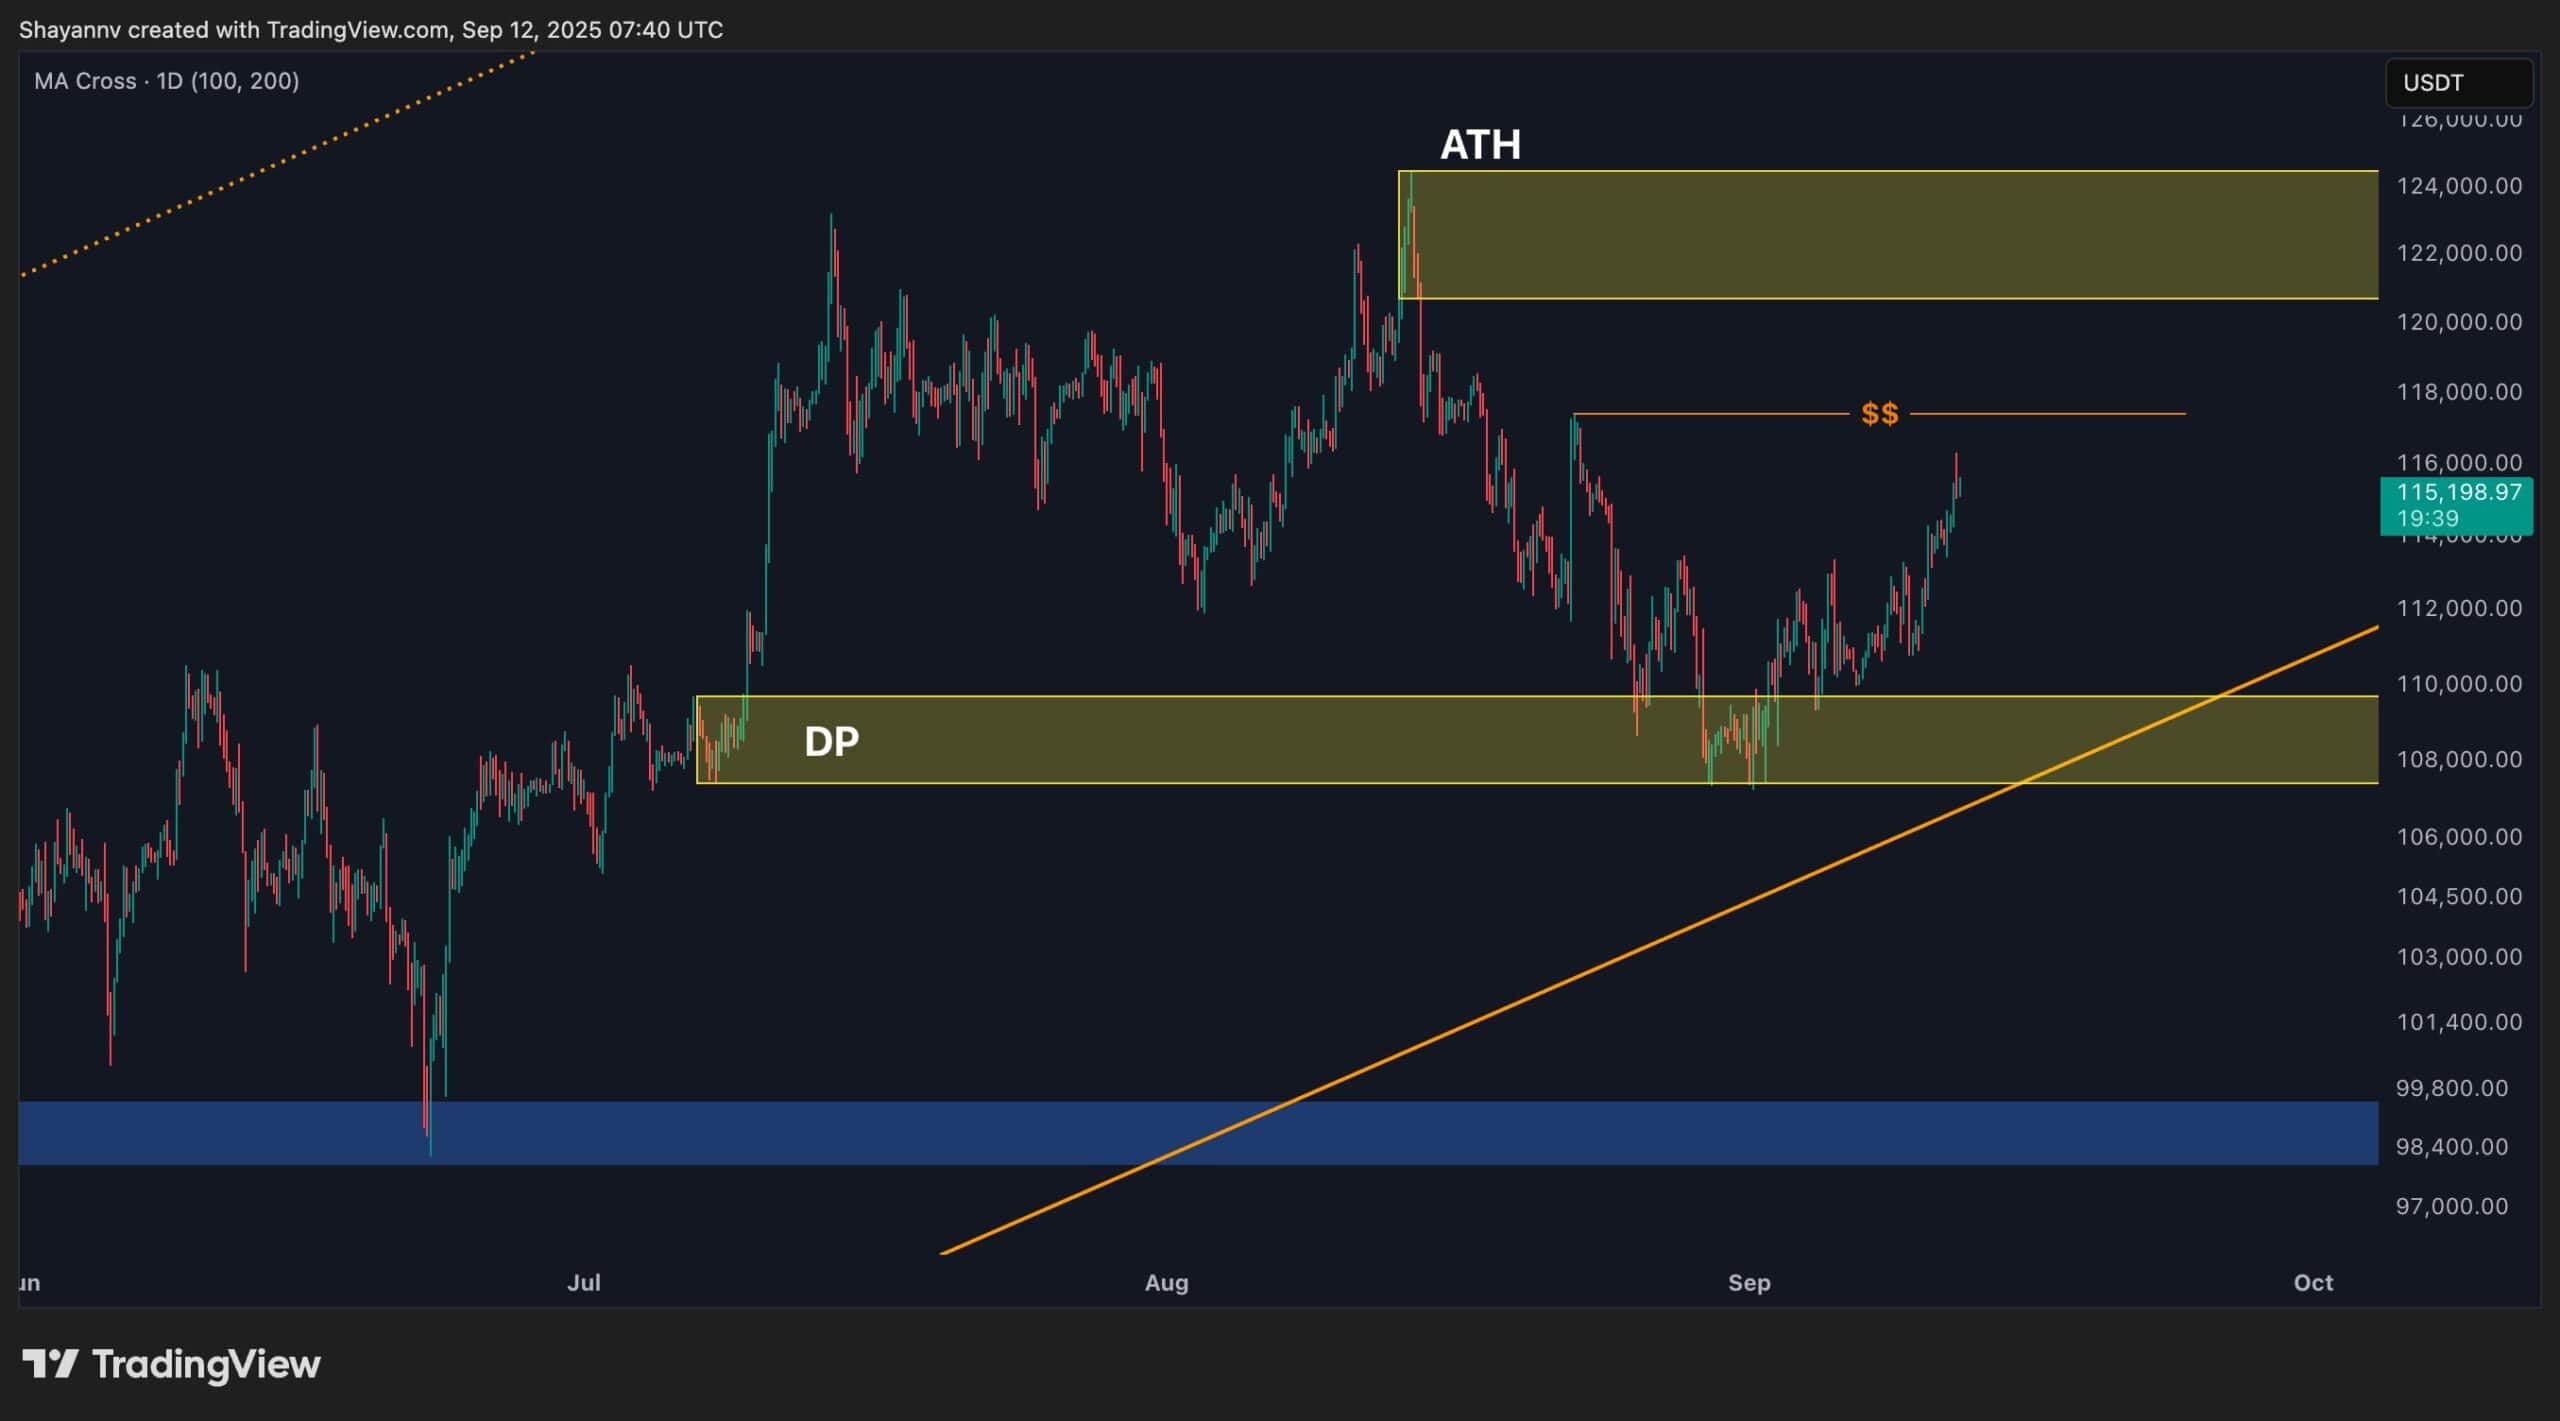
The 4-hour chart reveals that BTC is making gradual progress but is currently facing resistance within a supply zone located between $115K and $118K—identified by recent liquidity clusters. The bounce from the DP base has been pronounced; however, prices have since entered into a tighter range.
This structure illustrates Bitcoin being squeezed between support at approximately $112K and resistance just below $118K. A significant breakout from this consolidation phase will dictate short-term trends: an upward movement could trigger momentum towards reaching new highs while failure here risks pulling prices back down toward around $110K’s decision point base. The clear reactions near these critical boundaries indicate that traders are awaiting fresh catalysts to determine market direction.
On-Chain Insights
By Shayan
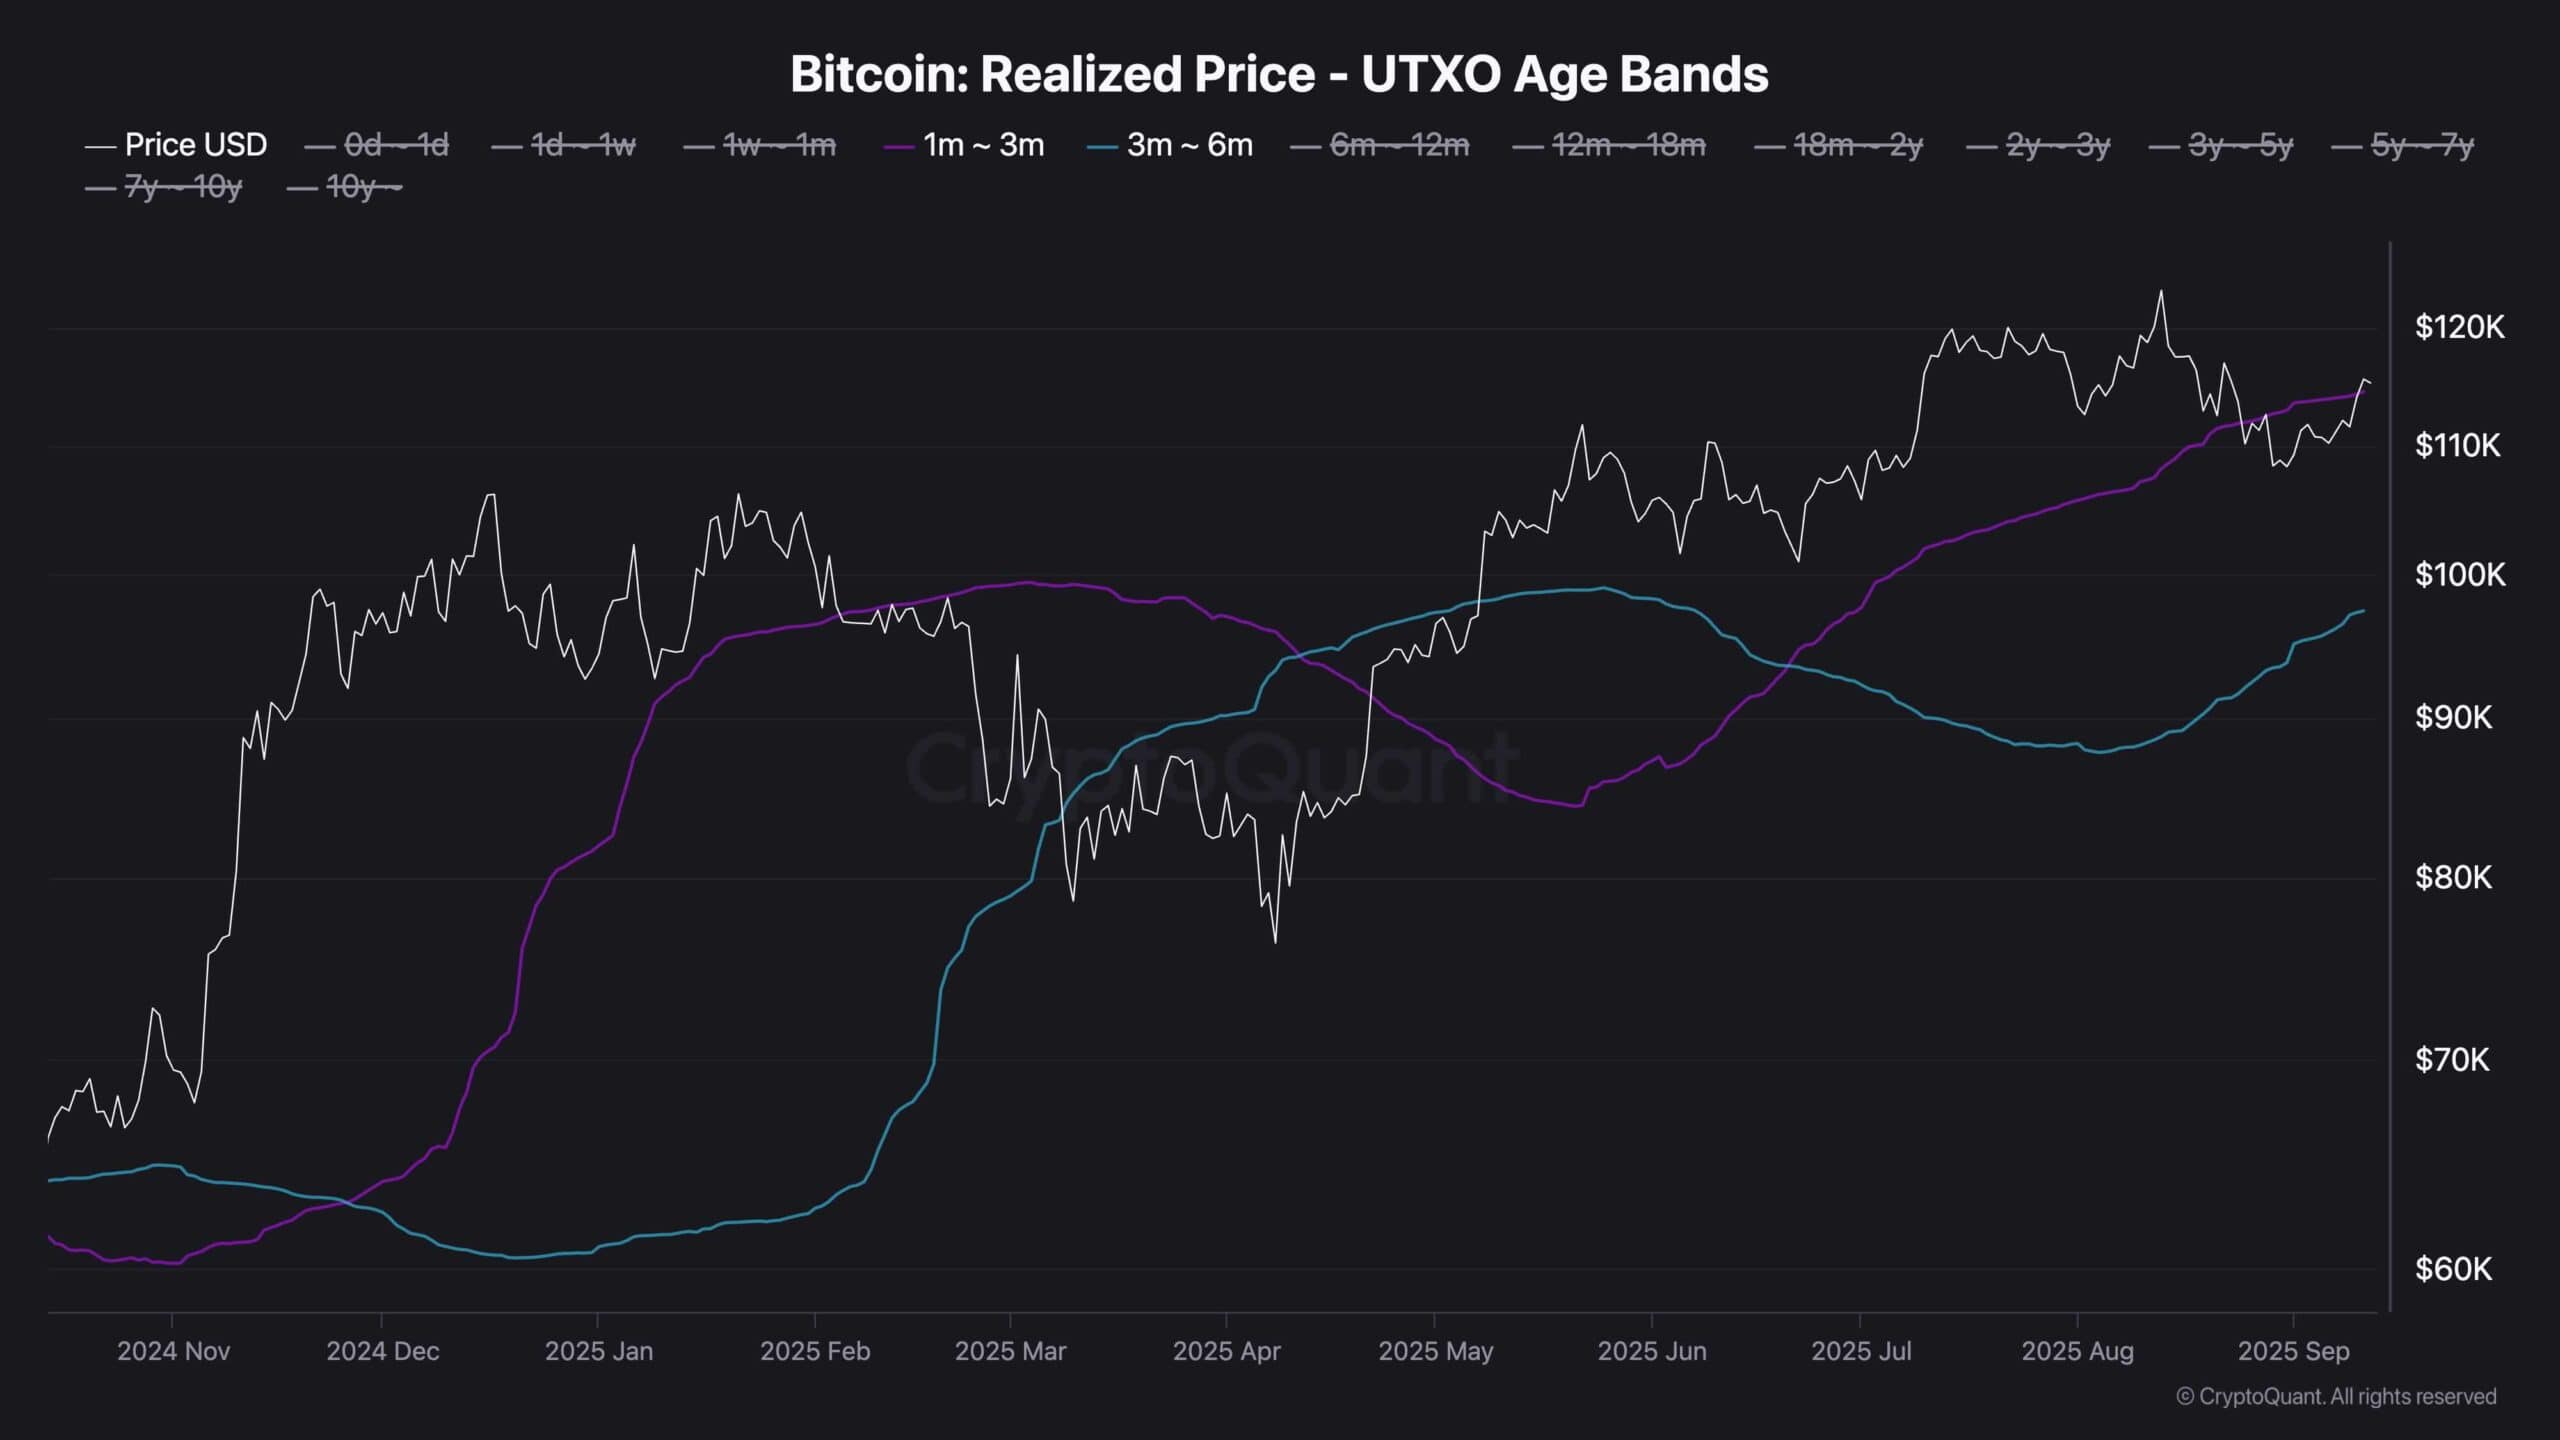
The Realized Price metric for mid-term holders (those holding assets for 3–6 months) has historically acted as an important pivot point in market dynamics—serving both as support during uptrends and resistance during downturns. This metric provides insight into average acquisition costs among this group of holders which can reflect broader market sentiment.
The recent rebound from around $107k has pushed Bitcoin slightly above mid-term holders’ Realized Price set at approximately $114k; thus placing them at breakeven points reduces immediate sell-off pressures significantly. Consequently, this area becomes pivotal for future market movements.
A robust breakout followed by sustained trading above this level would likely restore confidence among mid-term holders potentially igniting another bullish phase capable of driving Bitcoin towards unprecedented heights once again. On the other hand though failing to maintain positions over $$114k may revert sentiment back towards caution paving way deeper corrective actions ahead instead.