Bitcoin currently finds itself at a crucial support level, where its next movement could significantly influence the short-term trend. One analysis indicates a potential brief rebound before another decline, while another suggests that maintaining support might initiate a relief rally.
Trader Predicts Short-Term Bounce for Bitcoin Before Further Decline
A daily chart of Bitcoin shared by experienced trader Matthew Dixon illustrates the possibility of a short-term upward movement prior to another downturn. This setup implies that $BTC may initially rise to pressure short sellers, only to reverse course if resistance is encountered.
The chart identifies Bitcoin around $66,170 and highlights potential upside targets within the Fibonacci bands ranging from approximately $69,483 to $74,894. This range appears to be where Dixon anticipates prices will test before momentum wanes again. In essence, this analysis does not predict an enduring breakout just yet.
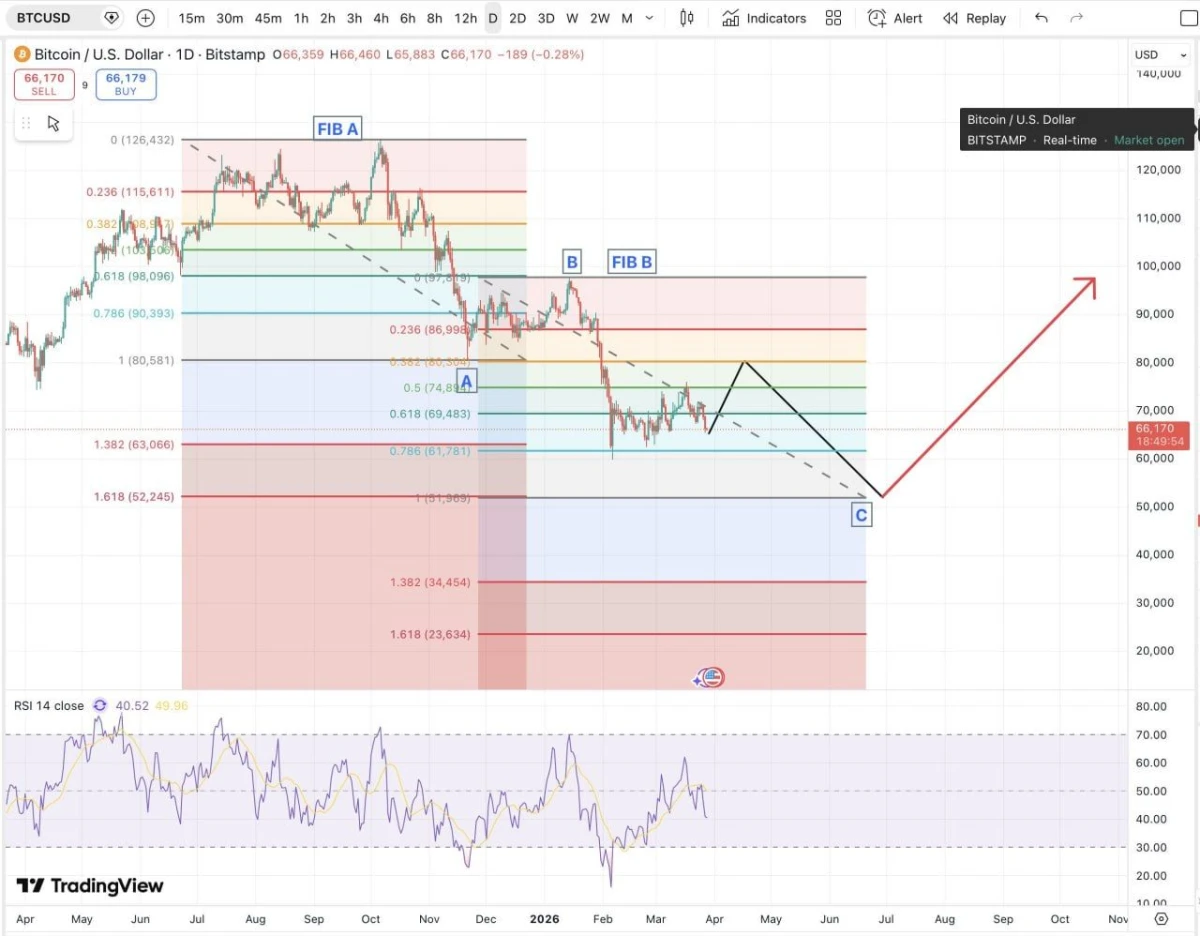
Bitcoin Short Bounce Setup. Source: Matthew Dixon on X
A dashed descending trendline continues to indicate downward pressure on the broader structure. The black trajectory shown in the chart depicts a temporary rally hitting resistance followed by a drop towards zone C near $51,969. Subsequently, an upward projection suggests a more robust recovery toward significantly higher levels later on.
This perspective merges immediate bearish sentiment with long-term recovery expectations. Initially, Bitcoin could ascend enough to liquidate shorts; however, if sellers regain dominance near resistance levels as indicated in the chart’s projections for further declines may occur before any substantial upward movements materialize.
Dixon also issued caution regarding market dynamics by noting that price behavior can remain irrational longer than traders can maintain their positions effectively—highlighting risks associated with premature positioning in trades. Currently, while there seems potential for some bounce-back based on this analysis; it simultaneously keeps significant downside risks alive.
Bitcoin Approaches Critical Support Level as Trader Sees Potential for Short-Term Rally
A two-day Bitcoin chart presented by TedPillows shows $BTC trading within an essential support zone following earlier sharp declines this year. The analyst emphasizes monitoring the key level between $65,000 and $66,000 which now serves as immediate floor support.
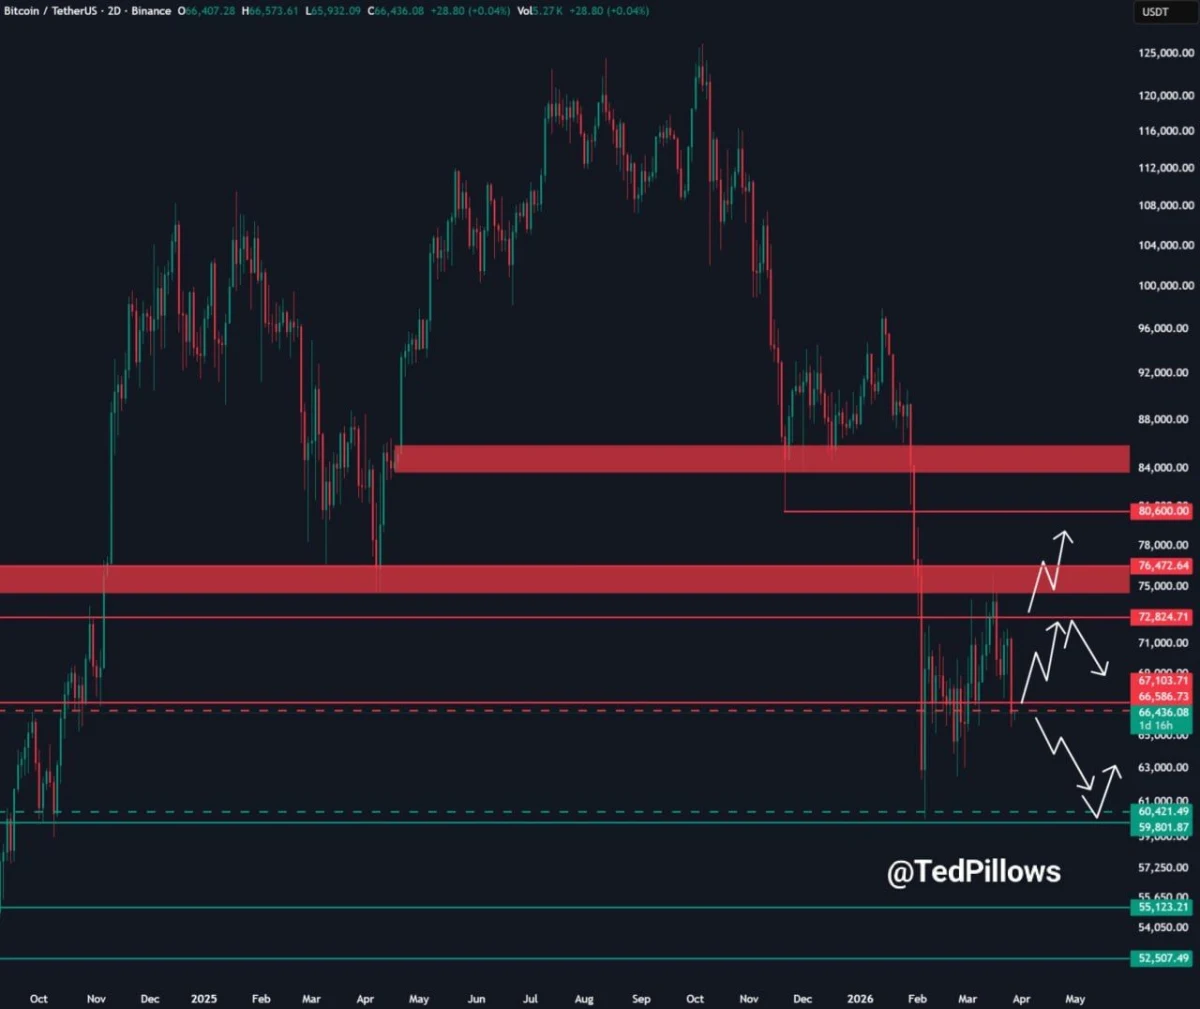
Bitcoin 2D Chart Showing Key Support Zone. Source: TedPillows on X
The analysis outlines several possible trajectories moving forward from here: If Bitcoin manages to sustain above this support band successfully; it points towards an anticipated rebound of about 6% – 8%, with targets clustered around low-$70k and mid-$70k ranges respectively—in such cases buyers must defend current zones vigorously pushing prices back into previous resistance territories.
Conversely though—the outlined scenarios also present downside risks should these supports fail—breaking below current bands could pave pathways downwards targeting lower supports closer towards values like$60k then mid-$50ks thereafter making structural integrity highly reliant upon whether existing ranges hold firm or not!
The primary takeaway is clear: Bitcoin has reached pivotal decision-making territory! While there exists established supportive structures suggesting possible relief rallies ahead—but should those floors break downwards? The charts indicate corrections might extend further until stronger bases are eventually formed!