Bitcoin has surged back into its previous trading range, with the liquidation heatmap revealing substantial liquidity clusters positioned above the current price. Meanwhile, attention on the weekly chart centers around the 200-week exponential moving average (EMA), a critical level that could influence Bitcoin’s upcoming trajectory depending on where it closes next.
Bitcoin Returns to Prior Range Amidst Concentrated Liquidity Zones Above
Bitcoin recently approached approximately $68,320 according to Binance’s 4-hour USD liquidation heatmap for $BTC. This followed a vigorous rebound in late February that lifted prices from recent lows back toward the midpoint of its earlier range. The rapid upward movement on February 26 came after an earlier decline this month pushed Bitcoin briefly into the low to mid-$60,000s before buyers intervened.
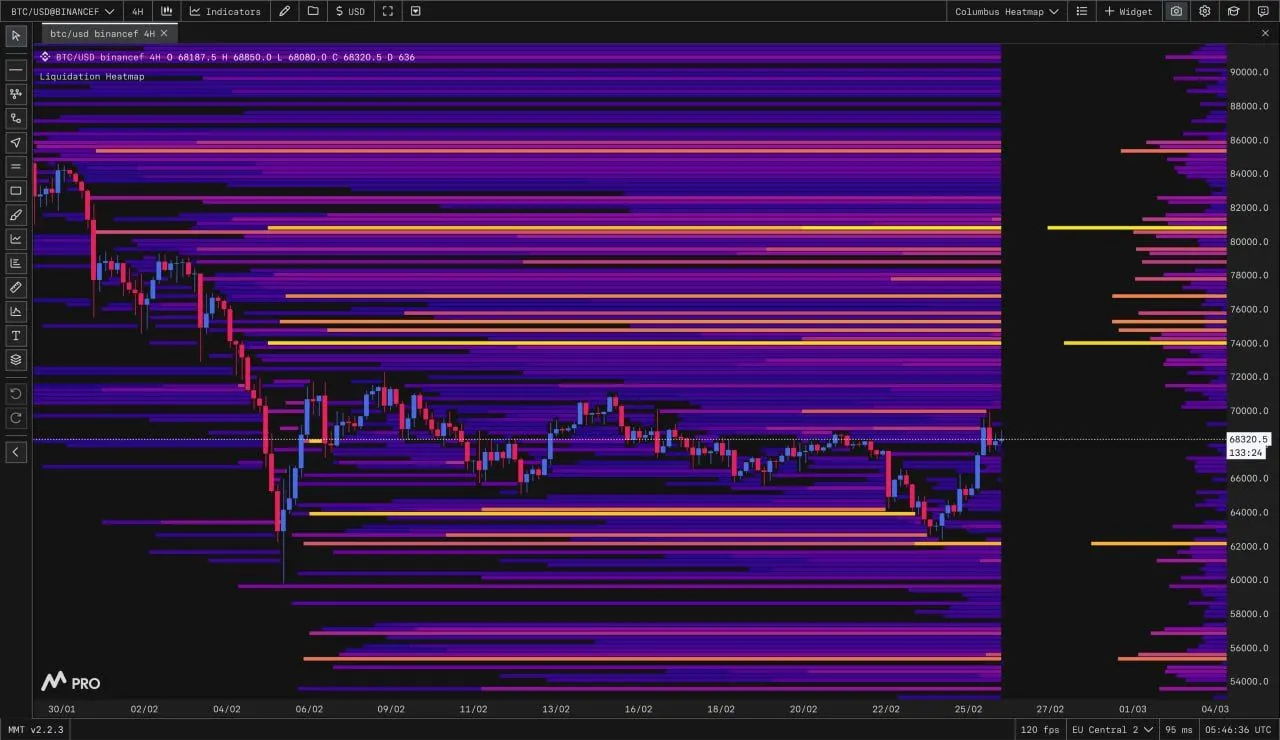
Visualization of Bitcoin’s Liquidation Heatmap. Source: Columbus via X and MMT Pro
The analyst Columbus shared insights on X, emphasizing that this latest surge was more than just a bounce; it marked Bitcoin reclaiming its prior range after successfully defending support at lower levels. He interpreted this as evidence that sellers were unable to push prices further down while buyers maintained control during the recovery phase.
The heatmap displayed prominent “liquidity bands” stacked above current market levels—ranging from low $70,000s up through around $80,000—indicating areas where sell orders and stop losses might accumulate. Conversely, significant liquidity zones also appeared below near mid and low $60,000s suggesting potential pressure points if prices reverse downward.
According to Columbus, future price action hinges on whether Bitcoin can sustain itself near this middle range area. Any retracement contained within these bounds would likely represent a consolidation or reset rather than a full breakdown. The next key focus will be those overhead liquidity pockets highlighted by brighter bands above today’s pricing.
Weekly Chart Highlights Test of Long-Term Trend Line
The weekly timeframe for Bitcoin reveals price challenging its 200-week EMA—a vital long-term trend indicator frequently used as a decision point for market direction shifts. TradingView charts illustrate an ascending channel guiding price movements throughout 2024 into early 2025. Recently though, prices have drifted toward this channel’s lower boundary while the upward-curving EMA supports beneath it—placing BTC at an important juncture where past trends either held firm or faltered.
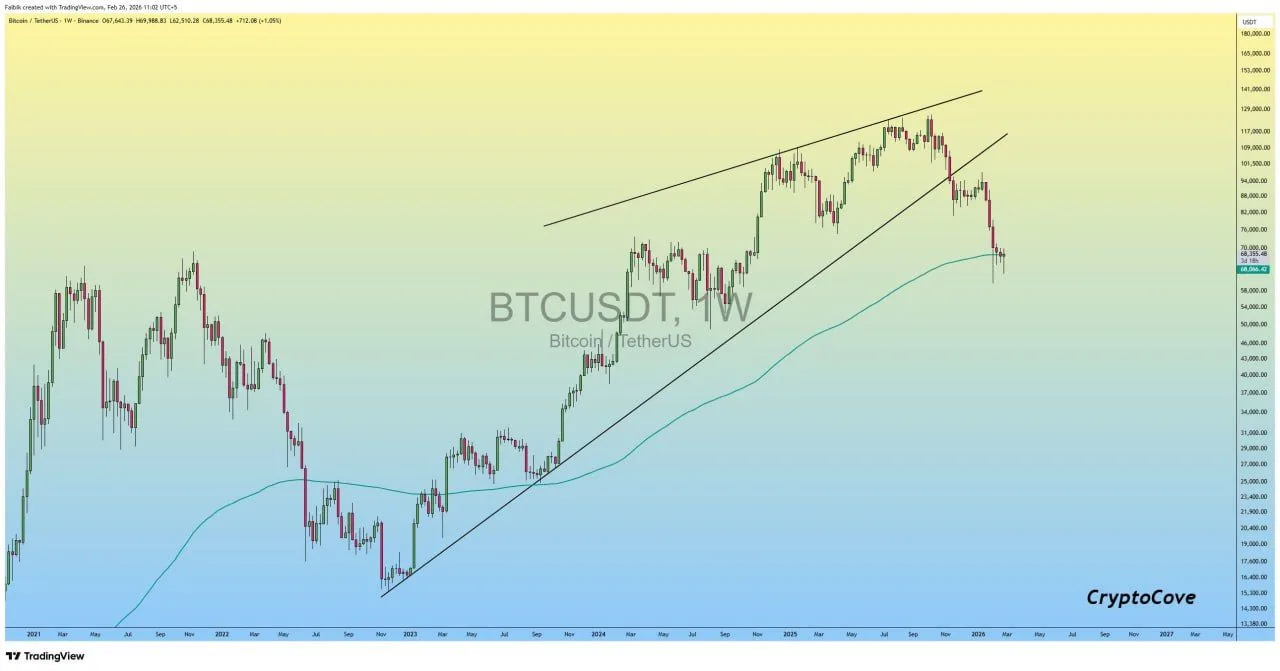
Weekly chart analysis by Captain Faibik via X showing BTC against TetherUS
Captain Faibik noted that closing above the 200-week EMA in upcoming weeks would indicate renewed strength and potentially signal progression toward higher resistance levels marked by the upper boundary of this channel. He described this scenario as testing control over long-term trends following recent pullbacks from channel highs—the boundaries having historically influenced subsequent directional moves multiple times before.
This weekly perspective also highlights how steadily rising averages have supported broader bullish momentum despite shorter-term fluctuations pulling prices closer to mean values periodically. Consequently, the forthcoming weekly close relative to this moving average remains crucial in determining whether BTC resumes its longer-term rotation within established channels or extends corrective phases further downward.