
Bitcoin is currently maintaining crucial breakout levels, with two significant charts indicating a potential surge towards $80,000. Nevertheless, $BTC must defend its support and overcome short-term resistance to validate this setup.
Bitcoin Develops Bull Flag as $80K Breakout Gains Attention
$BTC is trading around $77,800 on the hourly chart, revealing a possible bull flag formation. This pattern emerges following a robust upward movement and transitions into tight consolidation beneath resistance.
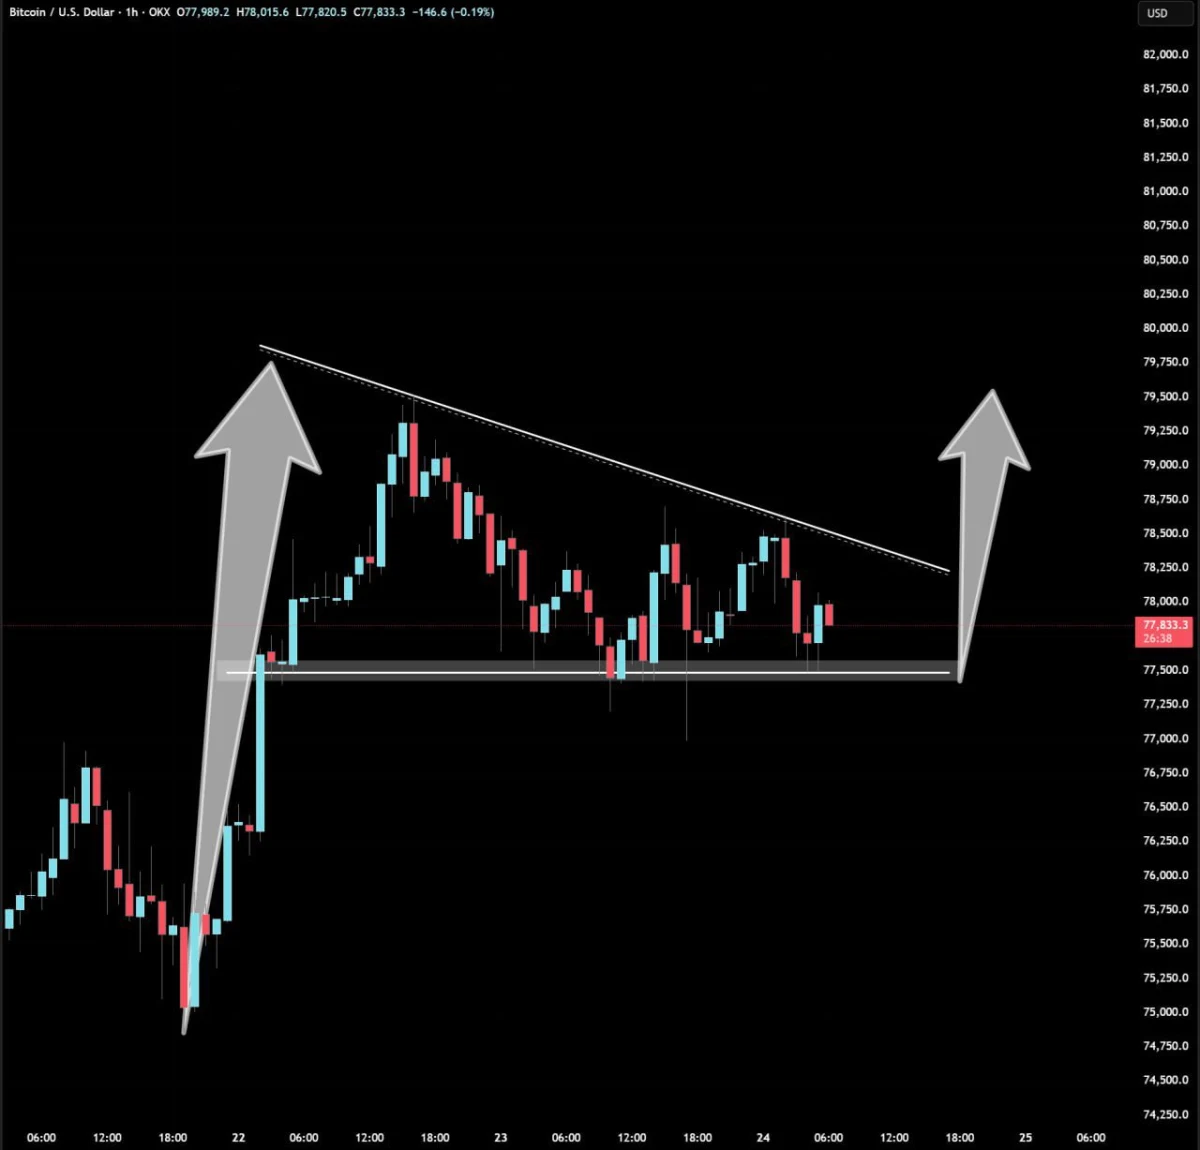
BTCUSD 1H Bull Flag Setup. Source: Elja via TradingView
A bull flag typically forms when the price pauses after an intense rally before preparing for another upward move if buyers regain dominance. In this case, $BTC maintains support near $77,500 while lower highs create a descending resistance line.
If the price breaks above that trendline, $BTC could advance toward the range of $79,500 to $80,000. This level aligns with projected movements illustrated in the chart.
The success of this setup hinges on maintaining support; any drop below $77,500 would undermine the pattern and postpone further upside momentum.
The overall chart indicates consolidation within a bullish framework; however,
$ BTC requires a breakout to affirm this move.
Bitcoin Retests Channel Breakout as Focus Shifts to $80K Zone
The cryptocurrency is revisiting its breakout from an ascending channel after surpassing a long-standing descending trendline. The current price remains close to this breakout area which now serves as an essential test for buyers.

BTCUSD Daily Channel Breakout Retest . Source : SuperBitcoinBro
The 50-day moving average lies below current prices , providing additional support near the lower boundary of the channel . As long as $ BTC stays above this breakout zone , it keeps prospects for moving towards over **$80k** alive .
Additionally , liquidation heatmaps indicate activity around **$80k**, highlighting its significance since prices often gravitate toward areas with substantial liquidity .
However , failure in retesting could weaken this setup ; should
$ BTC
fall back under both descending trendlines and channel supports , it would diminish strength behind such breakouts.
FAQ:
- What does it mean when Bitcoin forms a bull flag?
- A bull flag indicates that after significant upward movement in price followed by consolidation under resistance levels may lead to another surge if buying pressure resumes.
- If Bitcoin drops below certain levels like $77k what happens?
- A drop below key support levels can weaken bullish patterns and delay potential upward movements in price action.
- This article mentions liquidity zones; why are they important?
- Liquidity zones are critical because prices tend to gravitate towards areas where there’s high trading volume or interest from traders/buyers/sellers which can influence future pricing behavior significantly!
- How do I know if Bitcoin will reach **$80k**?
- While technical analysis provides insights based on historical data trends & patterns observed through charts – predicting exact future movements remains uncertain due largely external factors influencing crypto markets!
– It’s always wise consult multiple sources & analyses before making investment decisions!
– Stay updated news related developments affecting cryptocurrencies!
– Monitor closely these critical points mentioned throughout articles discussing specific formations/patterns!
– Always consider risk management strategies tailored personal circumstances !
- While technical analysis provides insights based on historical data trends & patterns observed through charts – predicting exact future movements remains uncertain due largely external factors influencing crypto markets!