Two significant Bitcoin charts have indicated crucial levels that may influence the next substantial movement in the market. One chart reveals strong support zones associated with previous bull cycle resets, while the other illustrates a short-term bullish configuration that relies on maintaining support.
Historical Pullbacks Below Key Holder Cost Bands Precede New Bull Markets
An analysis by Ali Martinez suggests that Bitcoin frequently initiates new bull markets after dipping below two long-term support zones related to holder cost basis. The current levels are positioned near the long-term holder realized price of $48,387 and at a minus 0.2 standard deviation band set at $36,657.
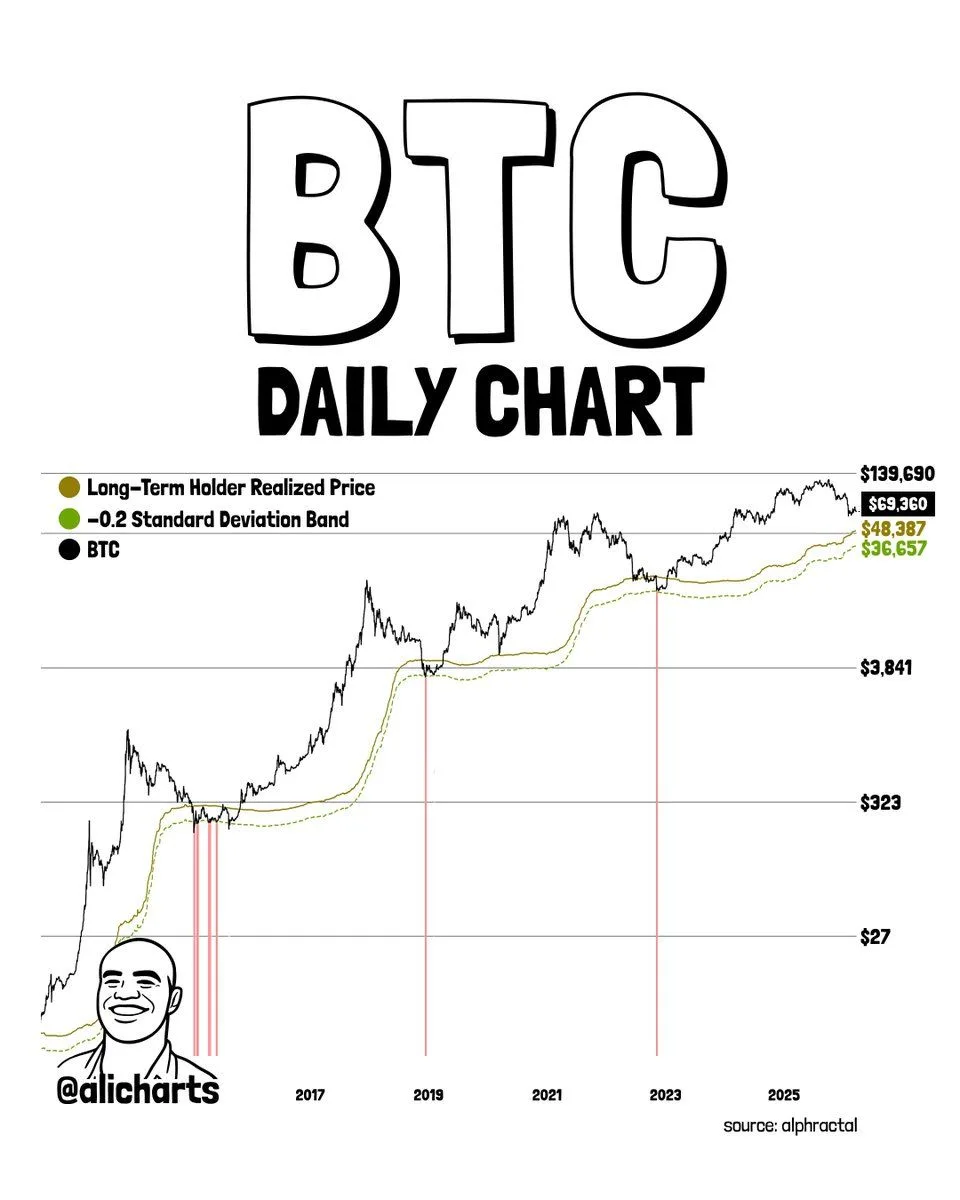
$BTC Daily Chart: Source: AlphaFractal, shared by Ali Charts on X
The chart illustrated several instances where Bitcoin fell below these bands before eventually entering a new upward trend. These areas are significant as they represent where long-term holders typically accumulated their coins and indicate historical deep discount price points. Consequently, Martinez is monitoring these zones for potential buying opportunities during dips ahead of the upcoming bull cycle.
However, it’s important to note that the chart does not imply Bitcoin must revisit either level; rather, it presents them as critical areas to observe if prices continue to decline further. At the time depicted in the chart, Bitcoin was trading around $69,360 while both support bands were situated well beneath this market level. Thus, a deeper correction into these ranges could attract traders who believe historical patterns might repeat themselves.
Bitcoin’s Bullish Setup Under Observation Amid Wedge Support and Moving Averages
<pA recent analysis from SuperBro highlighted a short-term bullish setup for Bitcoin while identifying an adjacent invalidation zone for risk management purposes. The daily chart displayed Bitcoin operating within an ascending wedge pattern with prices fluctuating between elevated support and resistance lines following a sharp prior drop.
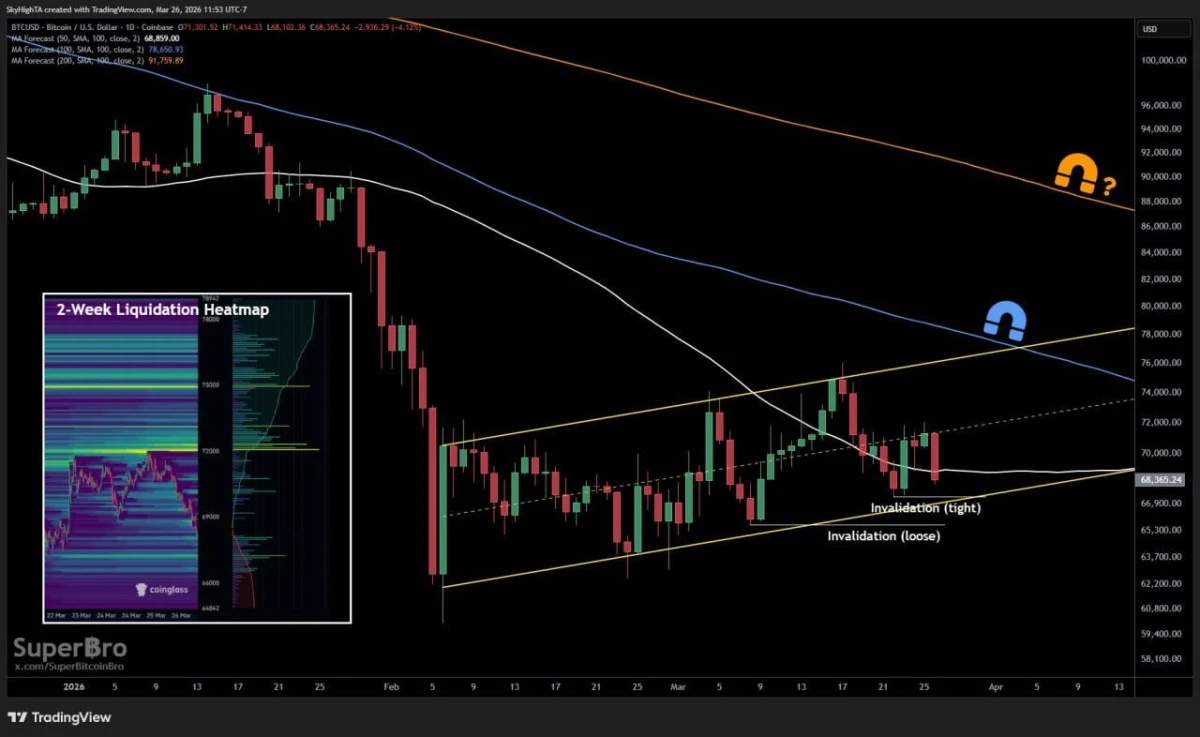
BTCUSD Daily Chart: Source: TradingView; shared by SuperBro on X
This analysis proposed that approaching closer to the lower boundary of this pattern could present traders with an appealing risk-to-reward scenario when betting on recovery movements. SuperBro characterized this area as optimal for establishing larger positions with minimized downside risks provided that bullish conditions remain intact. The analysis marked both tight and looser invalidation points just beneath the lower trendline.
The potential upward trajectory outlined in this chart hinges upon Bitcoin successfully reclaiming higher resistance levels and advancing towards key moving averages above it. Notably highlighted were the 50-day, 100-day, and 200-day averages which could serve as resistance should momentum strengthen further. Additionally included was a two-week liquidation heatmap from CoinGlass showing dense liquidity clusters surrounding current market levels—indicating possible volatility as traders monitor whether wedge support holds or fails.