The value of Bitcoin ($BTC) has sharply declined, currently trading at $65,675. This represents a 3.98% decrease over the past 24 hours and a staggering drop of 47.9% from its all-time high ($ATH) of $126K reached in October.
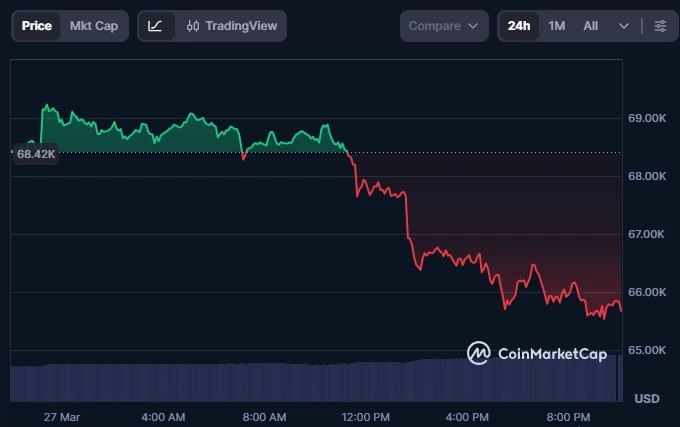
Source: CoinMarketCap
In the realm of Bitcoin futures, liquidations have hit $189.17 million, with long positions making up the majority at $173.24 million.
Other traditional assets are also feeling the pinch; gold and silver have experienced declines of 20% and 45%, respectively, from their peak values, while stocks within the Magnificent Seven group have dropped by as much as 34% since January’s highs.
What’s Causing Bitcoin’s Decline Today?
The recent downturn in Bitcoin’s price is largely attributed to rising tensions between the US and Iran along with its affiliates. Crude oil prices are now hovering around $99.13 per barrel, intensifying concerns about inflation due to escalating energy costs.
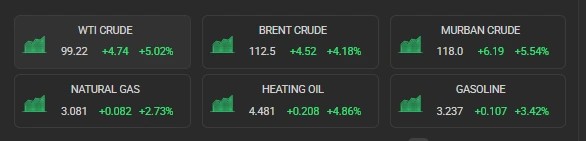
Source: OilPrice.com
The Federal Reserve is grappling with uncertainty regarding interest rates amidst these new inflationary pressures stemming from Middle Eastern conflicts; current US inflation stands near 3%, significantly above their target rate of 2%.
Additonally, today marks a significant event for derivatives as approximately $16.38 billion worth of Bitcoin and Ethereum futures contracts expired on Deribit exchange—the largest single-day settlement this year.
This situation has led to bearish sentiment among institutional investors; spot Bitcoin ETFs recorded net outflows totaling $306.44 million between March 26 and March 27.
$BTC Price Forecast
<pMarket analyst Aksel Kibar suggests that Bitcoin is following previous bearish wedge patterns which could indicate a potential decline towards the level of $52.5K.
Referencing my analysis during earlier bearish wedge formations—similar patterns may be emerging.
This isn’t necessarily predictive.
A breakdown below this lower boundary could signal movement toward $52.5K.
$BTCUSD https://t.co/0l6eu30Pu1 pic.twitter.com/jYxEYlKqS7
An additional analyst believes that once $BTC approaches around $50K, it will signify bottom formation for investors looking for bullish opportunities in upcoming trades.
Bitcoin hasn’t yet entered its bottoming phase.
If it falls toward the level near $50k that would indicate a bottom formation occurring.. pic.twitter.com/OHtULKtQLM
Goldman Sachs has already identified what they believe to be a market bottom while Peter Schiff criticizes how despite record hype surrounding cryptocurrency adoption the coin fell below its previous peak value set back in 2021 at $69k .
The developments concerning US-Iran relations over this weekend will be crucial factors to monitor alongside resulting energy prices impacting investor behavior moving forward . </P