The price of Bitcoin experienced a decline for the second day in a row as traders decided to take profits after the cryptocurrency surpassed the significant $70,000 resistance level, buoyed by positive U.S. inflation data.
Key Highlights
Bitcoin has developed a bearish pennant formation on its daily chart.
Futures open interest has steadily decreased over recent months, reaching its lowest point since 2024.
Spot Bitcoin ETFs have lost billions in assets over the last four months.
Dramatic Drop in Bitcoin Futures Open Interest
On Monday, Bitcoin ($BTC) fell to $68,500 from a weekend peak of $70,800. This marks a 45% drop from its all-time high of $126,300.
Data from external sources indicate that demand for Bitcoin has softened recently and this trend might persist throughout this week due to both the U.S. President’s Day holiday and ongoing celebrations for China’s Lunar New Year.
Despite China banning cryptocurrencies in 2020, it remains one of the most engaged markets within crypto trading. Consequently, liquidity levels are expected to be lower than usual during these festivities.
The futures open interest metric continues its downward trajectory—a clear indication that investor enthusiasm is diminishing. As of Monday, it stood at $43 billion—the lowest since September 2024—down sharply from last year’s peak near $95 billion. This suggests reduced leverage usage among traders.
You may also find interesting: CryptoQuant highlights an $863 million loan exposure at Nexo amid steady confidence despite market pullback
The recent dip in Bitcoin’s price also reflects profit-taking following gains triggered by Friday’s release of U.S consumer inflation figures showing headline CPI easing to 2.4% in January while core inflation remained steady at 2.5%.
Additionally, inflows into spot Bitcoin ETFs have slowed significantly over recent months; these funds have seen asset outflows exceeding $677 million just this month alone—the fourth consecutive month with losses—totaling more than $6.8 billion shed over four months’ time.
Looking forward, market participants will closely monitor upcoming Federal Reserve minutes which should shed light on their latest policy meeting decisions. Furthermore, speeches by key Fed officials such as Raphael Bostic, Michele Bowman and Neel Kashkari are scheduled this week alongside potential Supreme Court rulings related to Donald Trump’s tariffs expected around September 20th.
Technical Outlook: What Charts Suggest About Bitcoin Price Movement
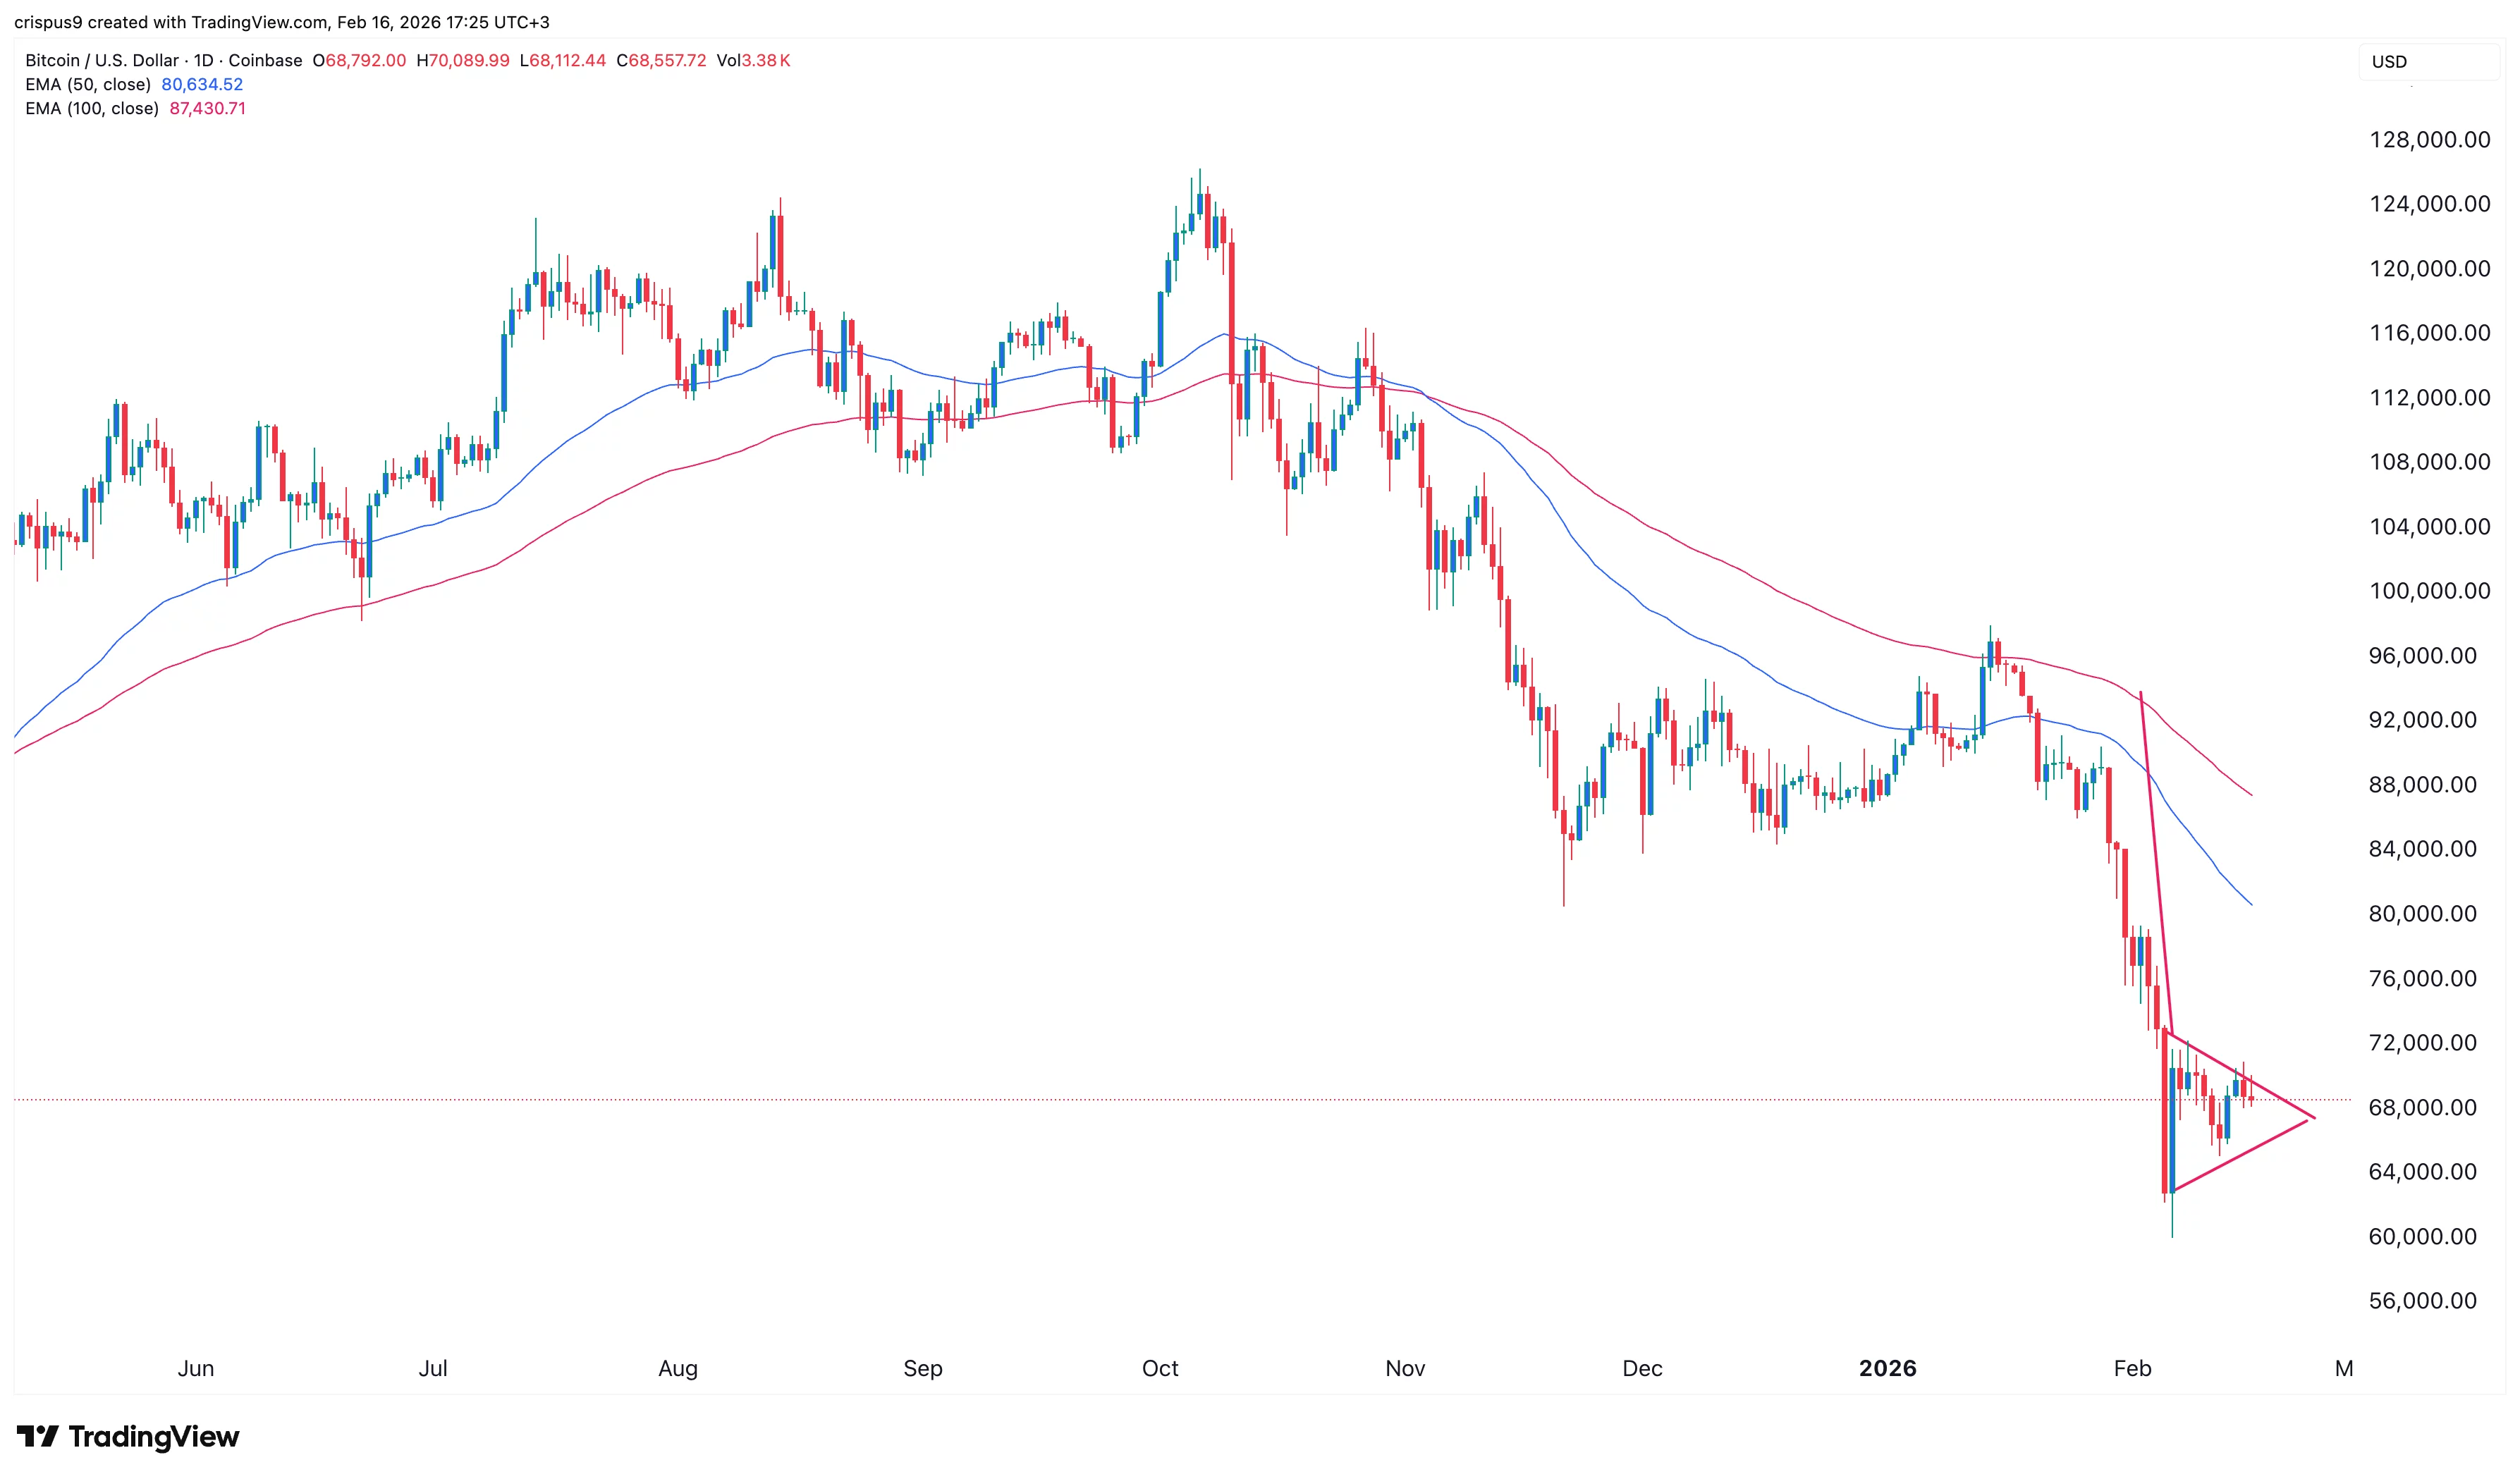
$BTC: Price Chart | Source: crypto.news
The daily chart reveals that after several months of decline bitcoin currently trades near $68,377 having slipped below all major moving averages—a bearish indicator signaling sellers dominate momentum now.
The coin remains under pressure indicated by staying beneath the Supertrend line while forming what technical analysts call a bearish pennant pattern made up of an initial sharp drop followed by consolidation inside symmetrical triangle boundaries on decreasing volume patterns typical before breakdowns occur further downwards.
Hence,the most probable short-term outcome points toward another downside breakout targeting support close to year-to-date lows around$60K.
For further insights: $XRP Ledger confronts challenges as tokenized Treasuries remain inactive on XRPL