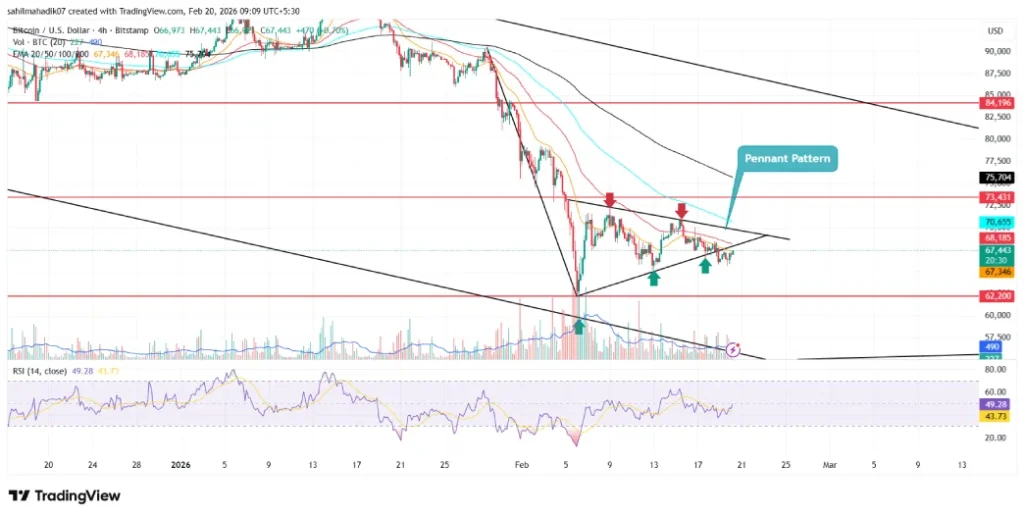
The price of Bitcoin has recently exited a brief consolidation phase, experiencing a bearish breakdown from an inverted pennant formation.
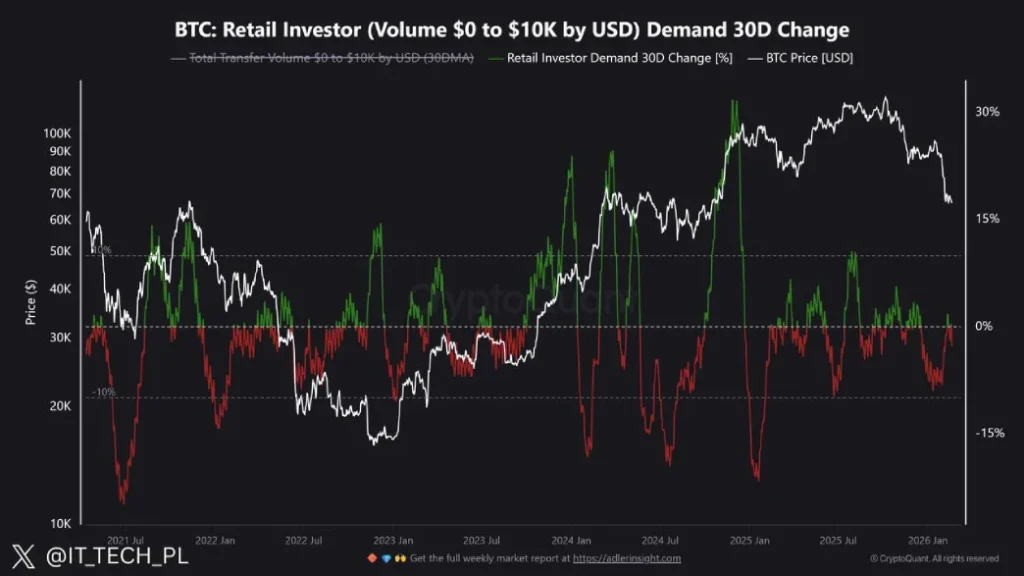
Retail demand over the past 30 days has dropped to levels reminiscent of the bear market in 2022 and the correction observed in mid-2024. The momentum indicator RSI currently sits at 48%, indicating that the short-term trend remains neutral amidst prevailing market uncertainties.
Bitcoin, recognized as the leading cryptocurrency by market capitalization, saw a modest increase of 0.82%, bringing its value back above $67,000. This rise can be attributed to a relief rally following significant corrections earlier this week caused by geopolitical tensions and macroeconomic instability. Despite this uptick, on-chain data reveals a sharp decline in retail investor engagement and widespread capitulation among smaller investors.
$BTC Experiences Weak Retail Activity While Institutional ETF Investments Remain Robust
Recent on-chain analytics indicate that there has been considerable withdrawal from Bitcoin among smaller-scale participants—those typically conducting transactions valued between $0 and $10,000. Activity within this segment has significantly diminished; retail demand metrics are now approaching lows last seen during both the downturn in 2022 and substantial pullbacks noted in mid-2024.
Over four months, Bitcoin’s price plummeted from $126,272 to its current trading level of approximately $67,217—a staggering loss of about 46%. The volume associated with this correction continues to decline sharply, suggesting minimal new capital influx or position establishment from everyday users. Historical patterns show that similar periods of low engagement were linked with Bitcoin prices hovering around $15,000-$20,000 during the prolonged bear phase of 2022 and around $25,000 during previous corrections.
This ongoing disconnection from retail flows persists despite broader market volatility; data shows no immediate signs pointing towards renewed participation from small wallet holders. Such trends have historically indicated extended consolidation phases before any meaningful shifts in overall sentiment occur.
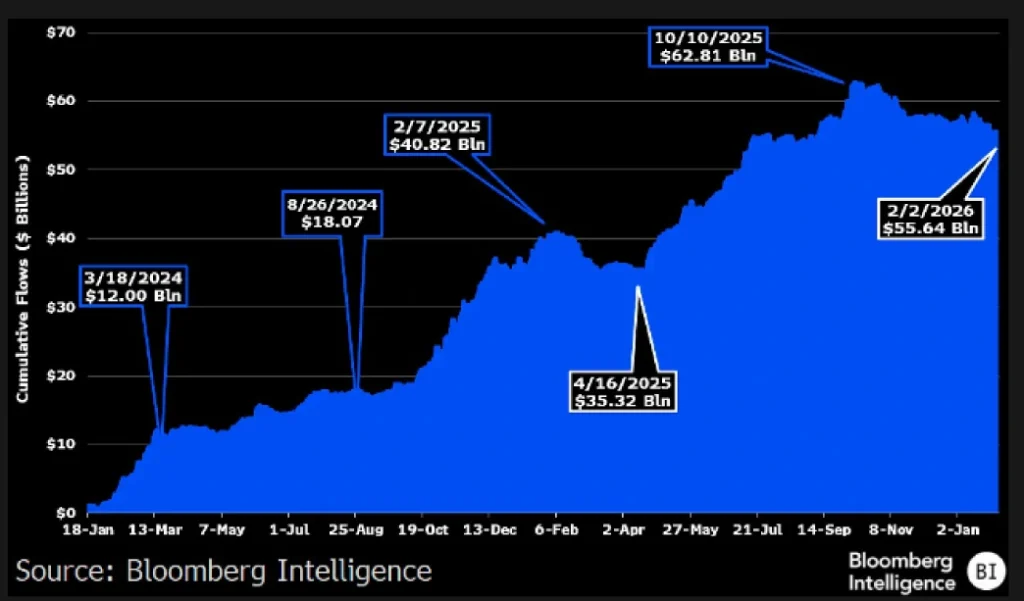
In parallel developments within financial markets for cryptocurrencies like Bitcoin ETFs have also seen notable declines regarding total capital commitments; net additions have decreased to $53 billion today compared to an October peak of approximately $63 billion—reflecting an erosion exceeding $8 billion amid roughly a 45% drop in asset value since reaching above$126K.
However over two years since their inception these investment vehicles managed impressive sustained net inflows totaling around$53 billion—far surpassing initial projections which estimated only between$5 billion-$15 billion for their first year—even those figures were considered optimistic based on industry consensus at that time!
Around current fluctuations surrounding bitcoin’s pricing hover near$67K indicating generally positive correlations across traditional finance channels despite recent fund movement dips reflecting wider institutional engagements where periodic withdrawals fail fully compensating prior buildups!
The Breakdown Signals Potential Drop Towards $55k
Sparking notable concerns last week as bitcoin prices corrected downwards falling dramatically—from peaks nearing $70K down towards about $67K amid heightened uncertainty across broader markets! During such downturns coins experienced bearish breakouts below support trendlines forming inverted pennants visible via four-hour charts!
This chart pattern often depicts long downward slopes representing dominant trends followed closely by shorter consolidations occurring between converging lines aimed at recuperating exhausted bearish momentum!
The latest breakdown suggests renewed selling pressures emerging within markets positioning assets for potential prolonged declines should they sustain losses beyond present thresholds—if so $BTC‘s trajectory could plunge further hitting lows near60k then potentially dropping all way down towards55k!
$BTC/USDT -1D Chart
Cautionary signals arise though as coin prices suggest brief retests against breached trendlines validating sustainability toward lower valuations should buyers re-enter pennant triangles driving recovery attempts upwards surpassing previous barriers above70k once again!
Please refer: Robinhood Chain Logs Four Million Testnet Transactions Within First Week As CEO Confirms Progressions Ahead!