The recent weekend proved harsh for risk-driven assets. Bitcoin plunged beneath the $80,000 mark on Saturday, dipping close to $74,500 before modestly recovering to around $78,500. This decline marks Bitcoin’s fourth straight month of losses—the longest downturn since the crypto winter of 2018.
What triggered this sell-off? A convergence of macroeconomic turmoil. President Donald Trump’s tariff threats spooked traders into exiting positions rapidly. On January 30 alone, over $2.2 billion worth of leveraged cryptocurrency trades were liquidated within 24 hours, with bullish investors suffering most from forced sales.
It’s no surprise that the Fear & Greed Index plummeted to a low reading of 14 today—signaling “extreme fear.” Even traditional safe havens failed to provide refuge: gold tumbled by 12% from record highs above $5,500 down below $5,000 in its sharpest single-day drop since the 1980s; silver collapsed by an astonishing 30%, marking its worst day since March 1980. Investors offloaded conventional “store-of-value” assets alongside cryptocurrencies as they scrambled for dollar liquidity.
However, today shows green candlesticks across nearly all top-100 cryptocurrencies by market capitalization—they are rebounding together. Is this a sign that recovery is near or just bulls catching their breath before another downturn? Let’s examine what technical charts reveal:
Bitcoin ($BTC) Price Outlook: Bearish Momentum Meets Oversold Conditions
This morning saw Bitcoin climb roughly one percent over the past day to trade at approximately $78,866. Yet despite this slight uptick, technical indicators remain overwhelmingly bearish even though prices have reached levels where rebounds might occur.
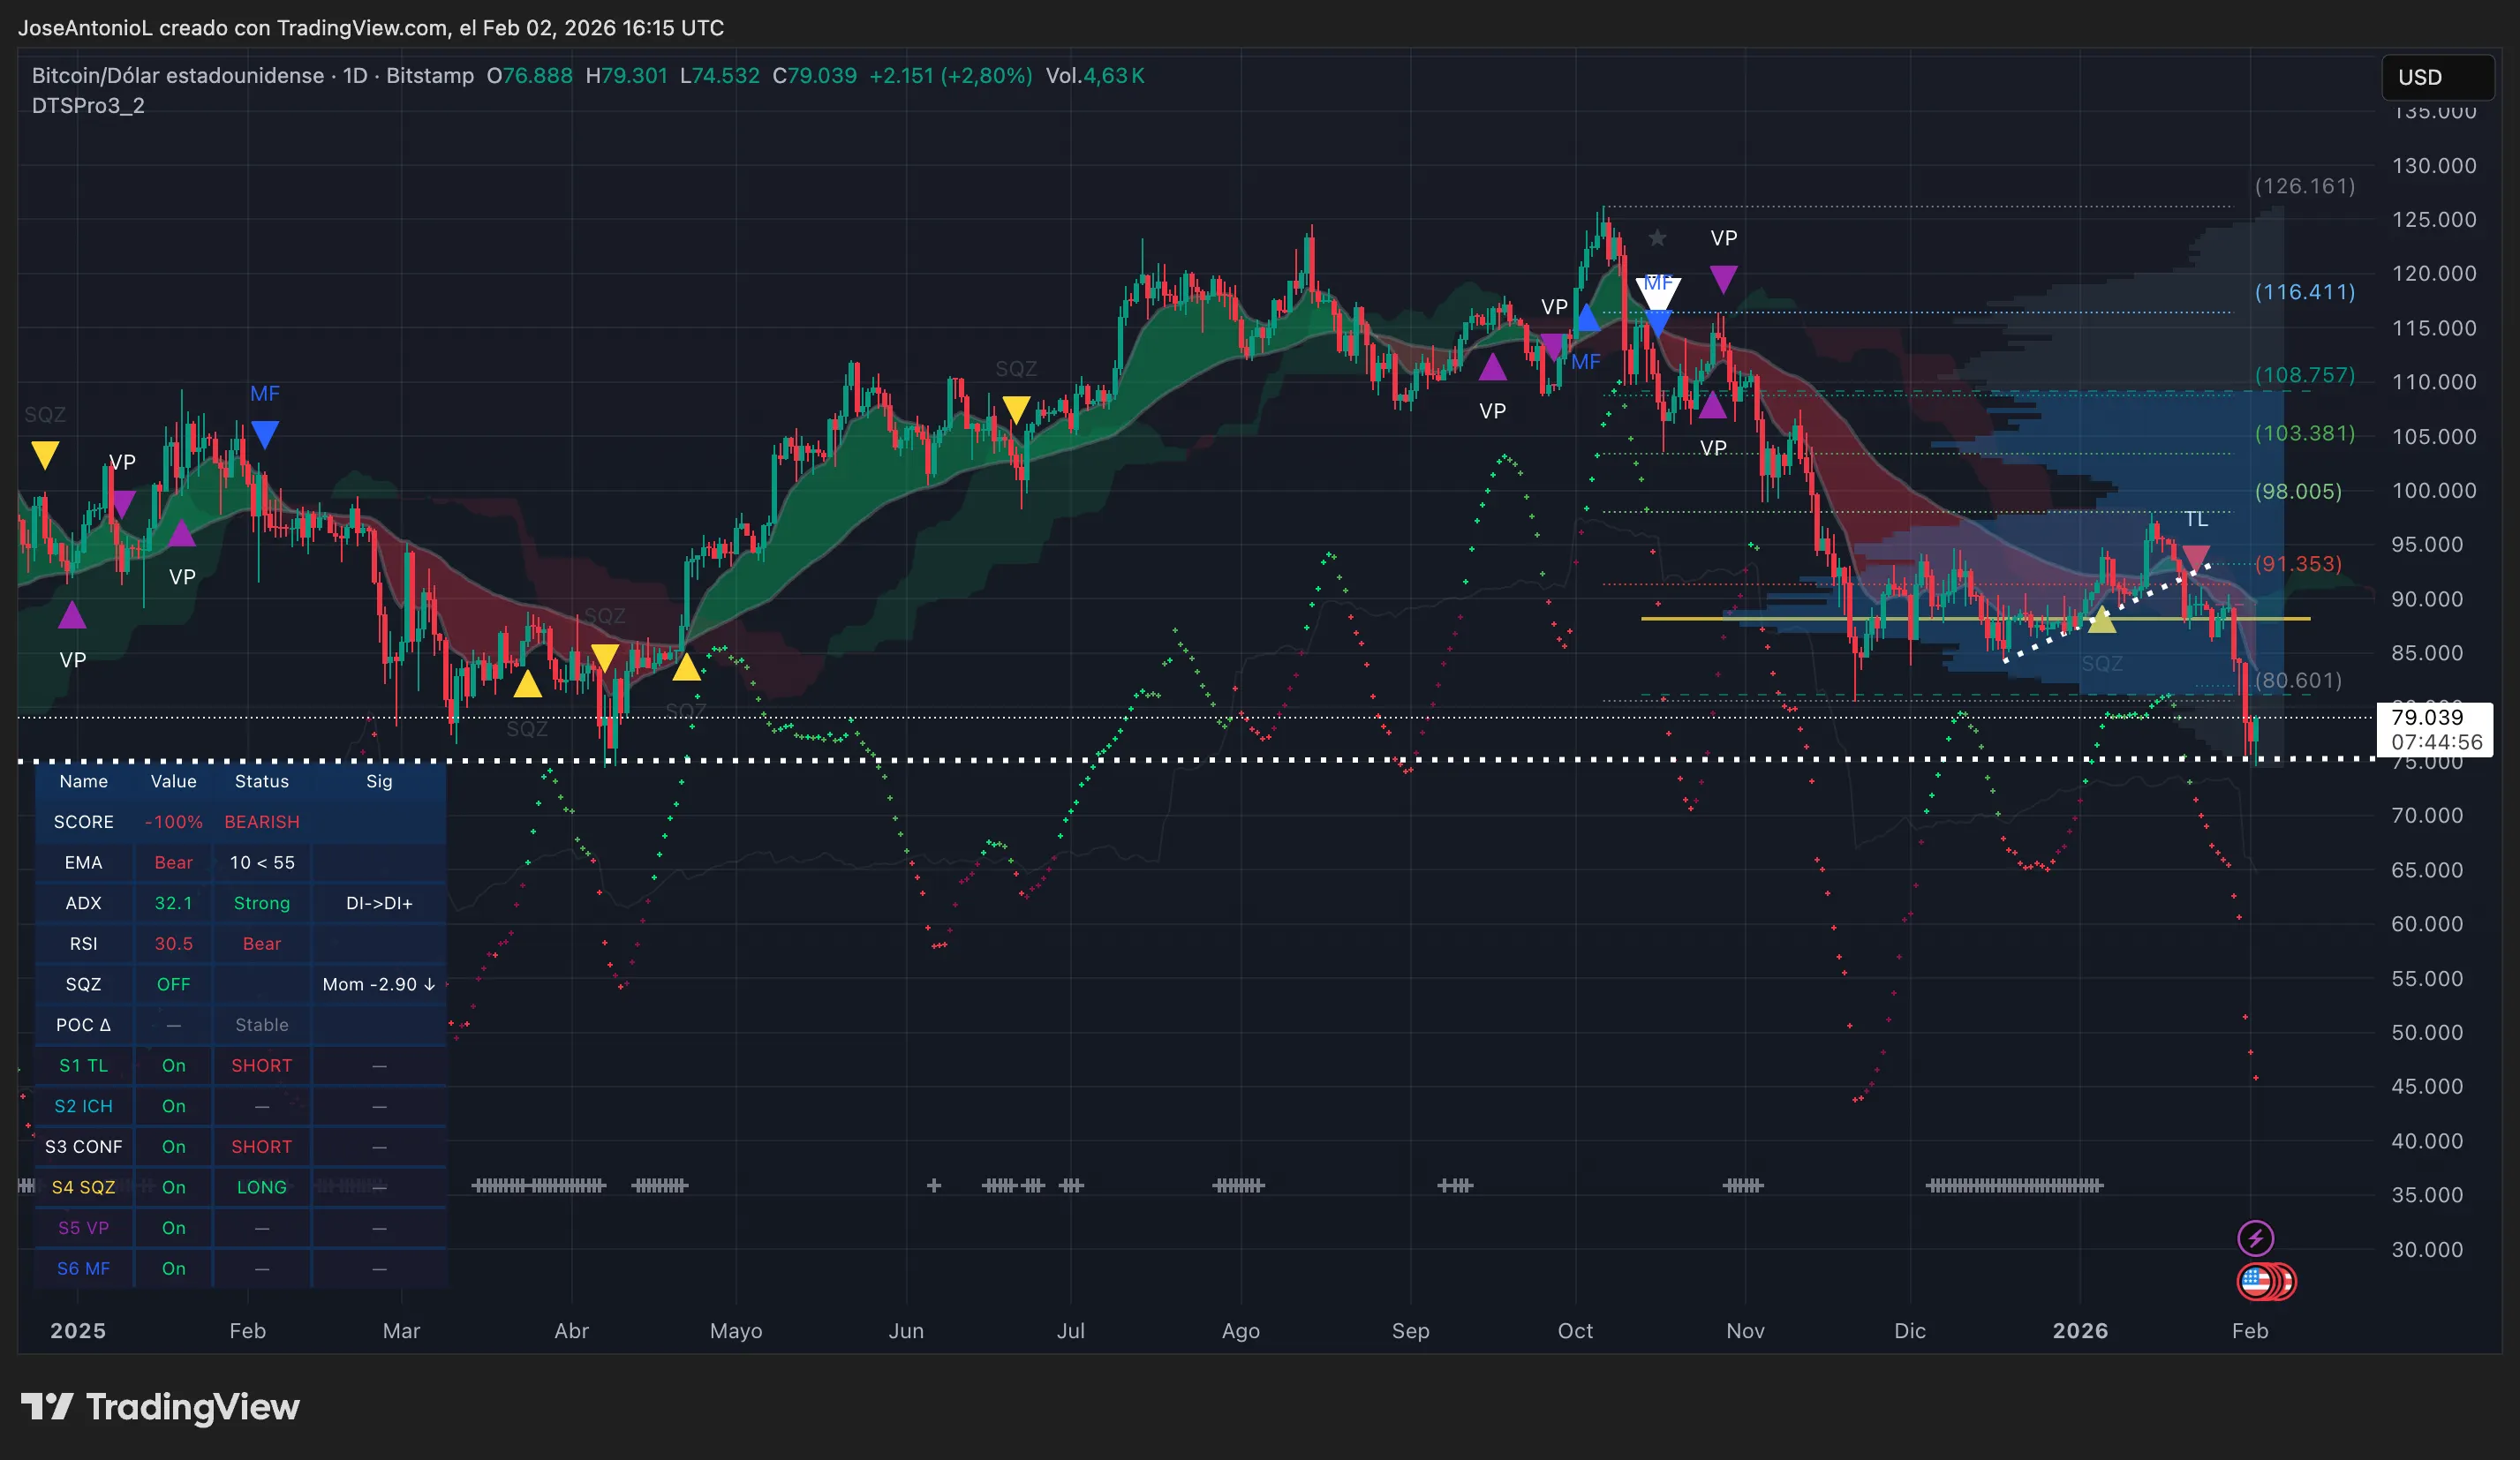
The daily chart offers little hope for bulls right now: Exponential Moving Averages (EMAs), which track short-, medium-, and long-term price trends help identify momentum shifts—currently show strong bearish signals as the shorter-term 50-day EMA sits below the longer-term 200-day EMA confirming downward pressure persists in Bitcoin’s trend.
The Average Directional Index (ADX), measuring trend strength regardless of direction on a scale from zero to one hundred—with values above twenty-five indicating robust trends—is currently at thirty-two point one signaling firm conviction behind this downtrend movement.
One glimmer amidst gloom lies in RSI (Relative Strength Index) readings falling exactly onto thirty—a threshold defining oversold territory where selling exhaustion may precede relief rallies although not guaranteeing immediate reversals.
Zooming into four-hour intervals reveals tentative attempts at recovery after touching support near seventy-four thousand five hundred dollars—the previously identified key level—but current candles indicate renewed selling pressure with ADX soaring beyond fifty-seven reflecting very strong momentum remains directed downward despite brief bounces off lows.
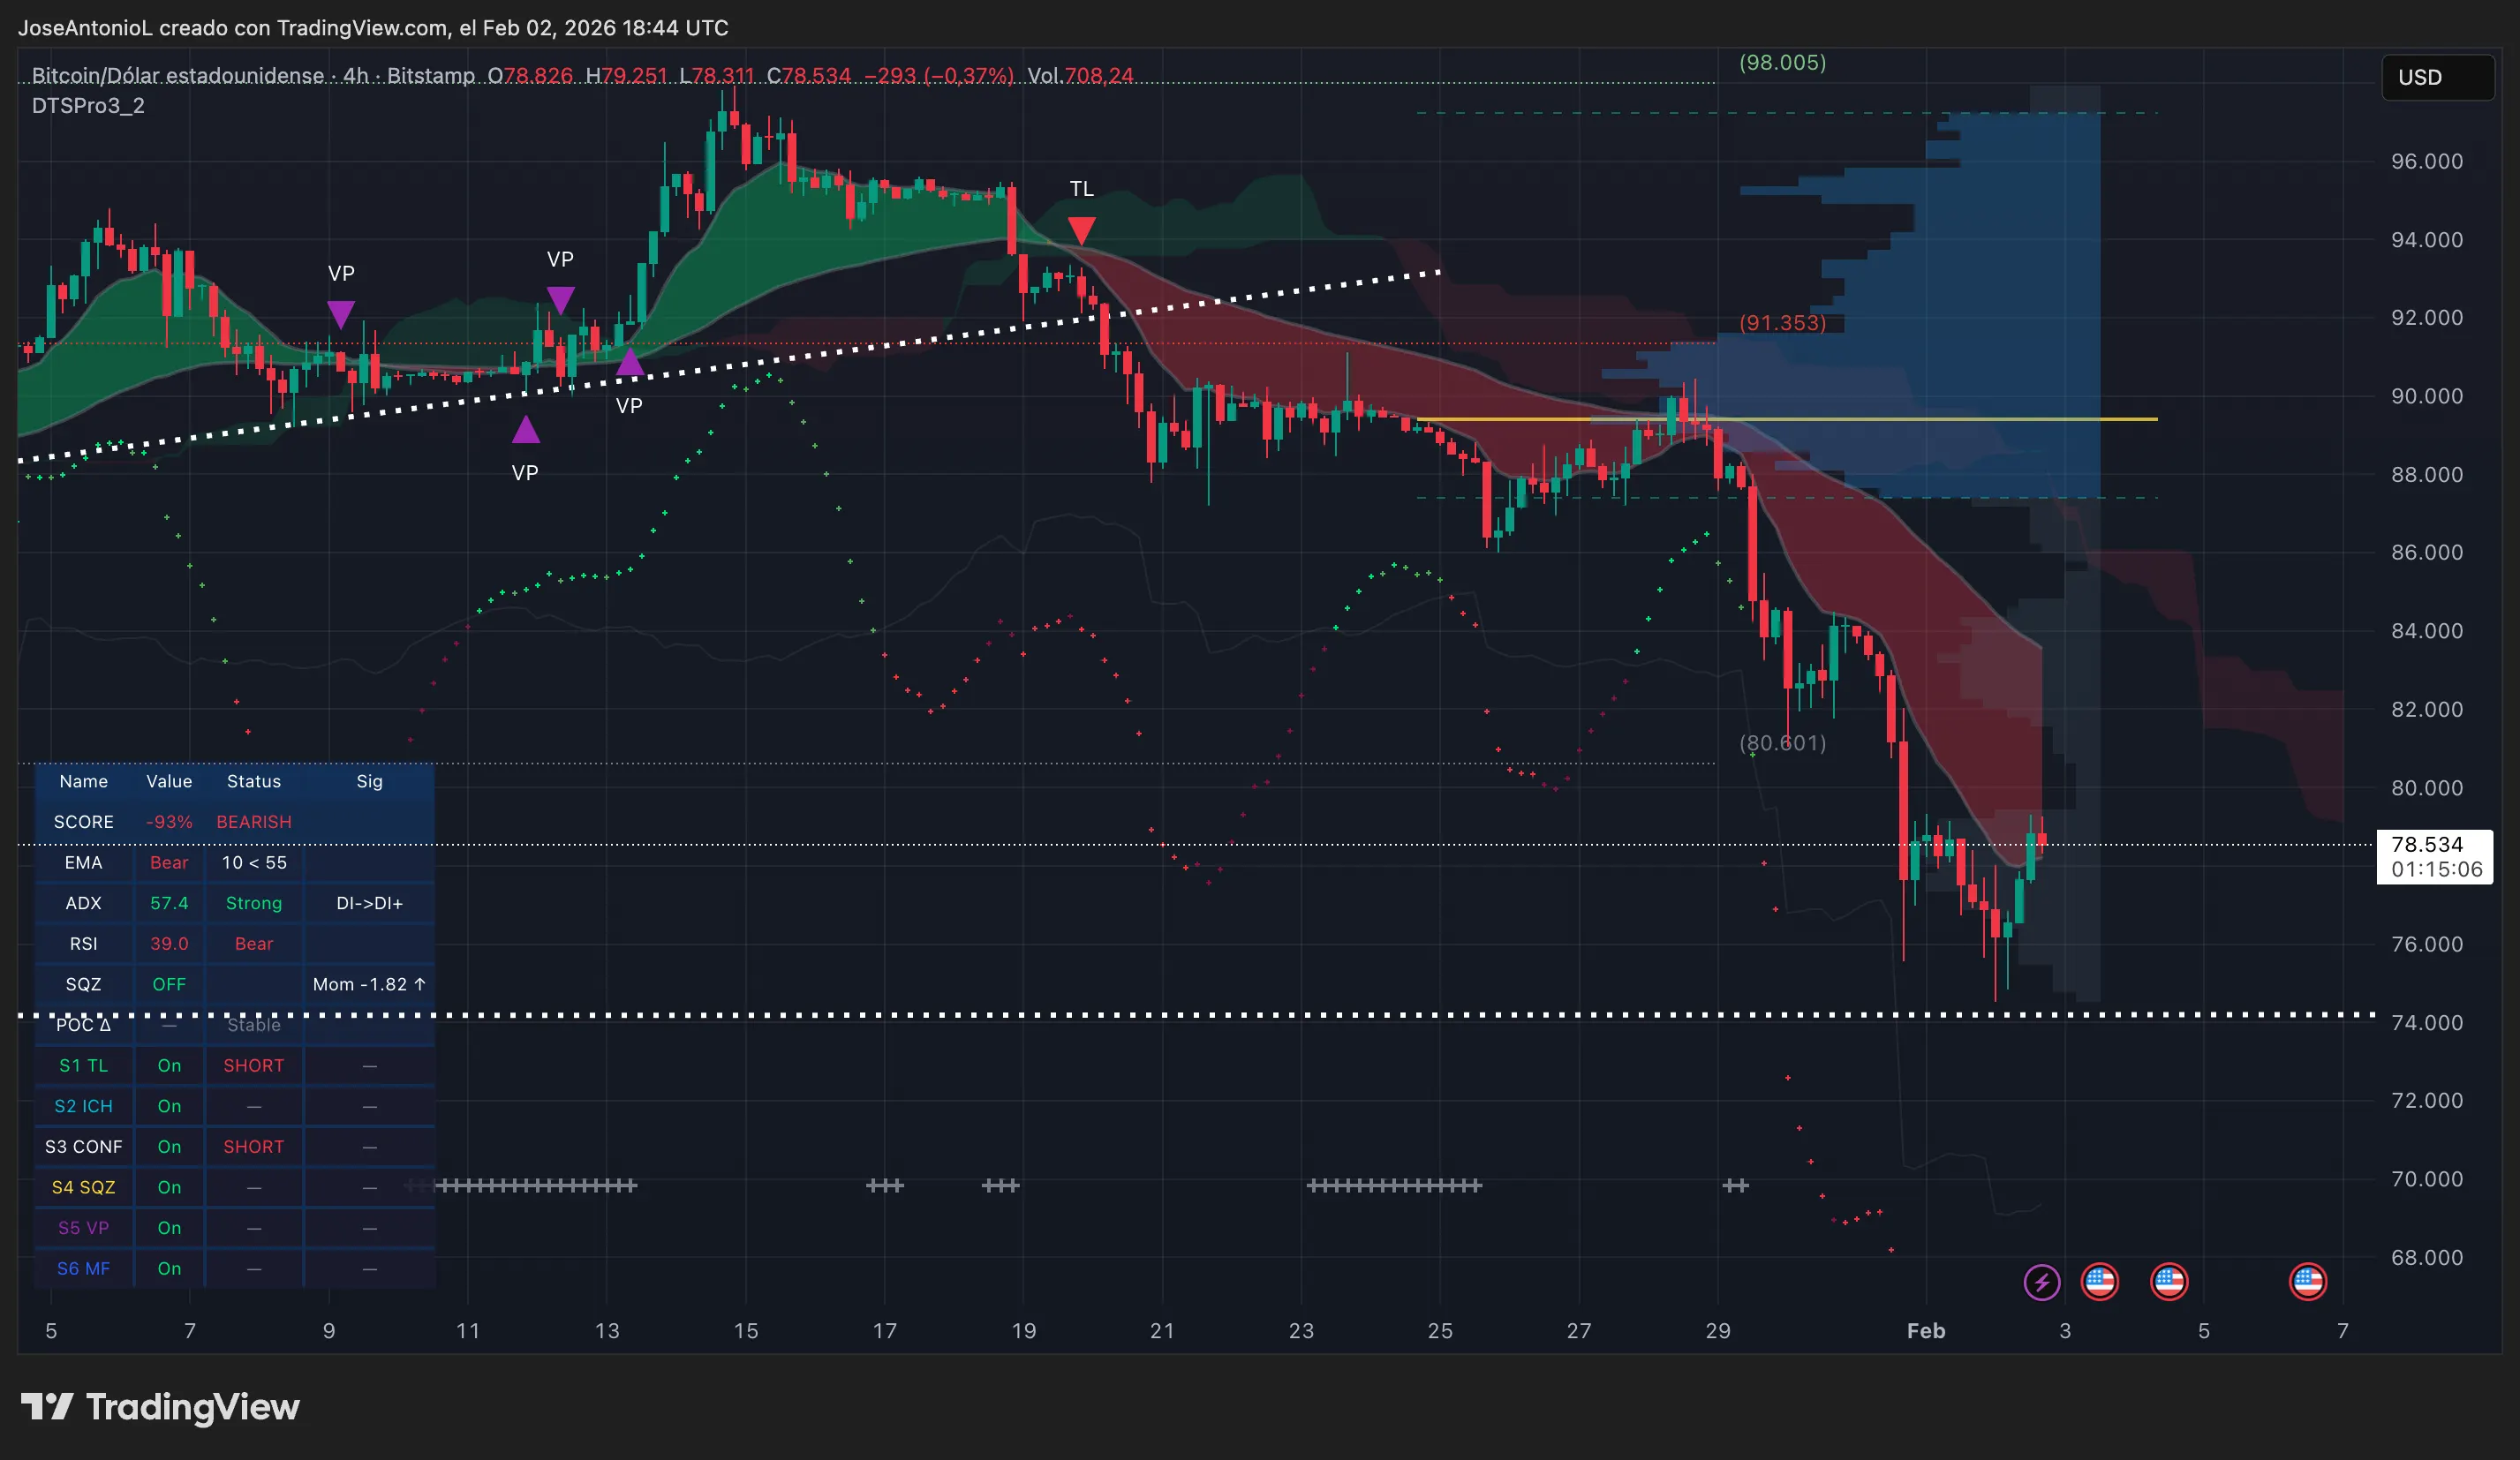
This suggests while short-term relief rallies are plausible following steep declines they fall short of signaling any sustained reversal yet.
Together with Bitcoin’s bounce today most major cryptocurrencies among top market caps also showed gains except certain exceptions like XMR and PUMP tokens but overall sentiment remains dominated by “extreme fear.”
A prediction platform called Myriad owned by Decrypt’s parent company reflects trader sentiment turning decisively bearish: odds now favor a drop toward sixty-nine thousand dollars over a surge back up toward one hundred thousand dollars at nearly sixty-eight percent probability—a dramatic shift compared with two weeks ago when bullish bets held eighty-five percent odds advantage.
This stark flip perfectly illustrates prevailing market psychology currently entrenched in caution and pessimism rather than optimism or confidence ahead.
The critical seventy-four thousand dollar support zone held firm during recent dips providing some stability; if maintained upon retesting it could pave way for consolidation between seventy-eight and eighty-five thousand ranges.
Conversely breaching below seventy-four K opens path toward next significant support near sixty-nine K representing roughly forty-five percent correction relative to October peaks around one hundred twenty-six K—potentially rewarding contrarian bettors who predicted such declines earlier via prediction markets.
On resistance fronts immediate barriers lie near eighty point six K aligned closely with long-term moving averages followed further up by ninety-one point three five K coinciding with EMA clusters forming formidable hurdles against upward moves thereafter structural resistance appears closer towards ninety-eight thousand dollars mark awaiting stronger buying interest before breakthroughs occur.
Key Levels To Monitor:Resistance:
$80,600 (immediate)
$91,350 (complex EMA region)
$98,000 (major structural ceiling)
Support:
$74,500 (joint low recently tested)
$69,000 (pivotal psychological target/prediction market benchmark)
Disclaimer
The opinions shared herein represent solely those of the author and serve informational purposes only without constituting financial advice or investment recommendations whatsoever.