Bitcoin faces a critical period to rebound before the year concludes, or else the Power Law model predicting its price trajectory could be disproven.
The Power Law is not a prophecy but rather a time-dependent regression that models Bitcoin’s long-term price movement as following a power curve. The so-called “deadline” refers to an ascending lower boundary—a floor—that increases daily regardless of Bitcoin’s market price.
If Bitcoin remains stagnant or declines during autumn, this rising floor will eventually meet the actual price, marking the first significant breach of this model throughout Bitcoin’s history.
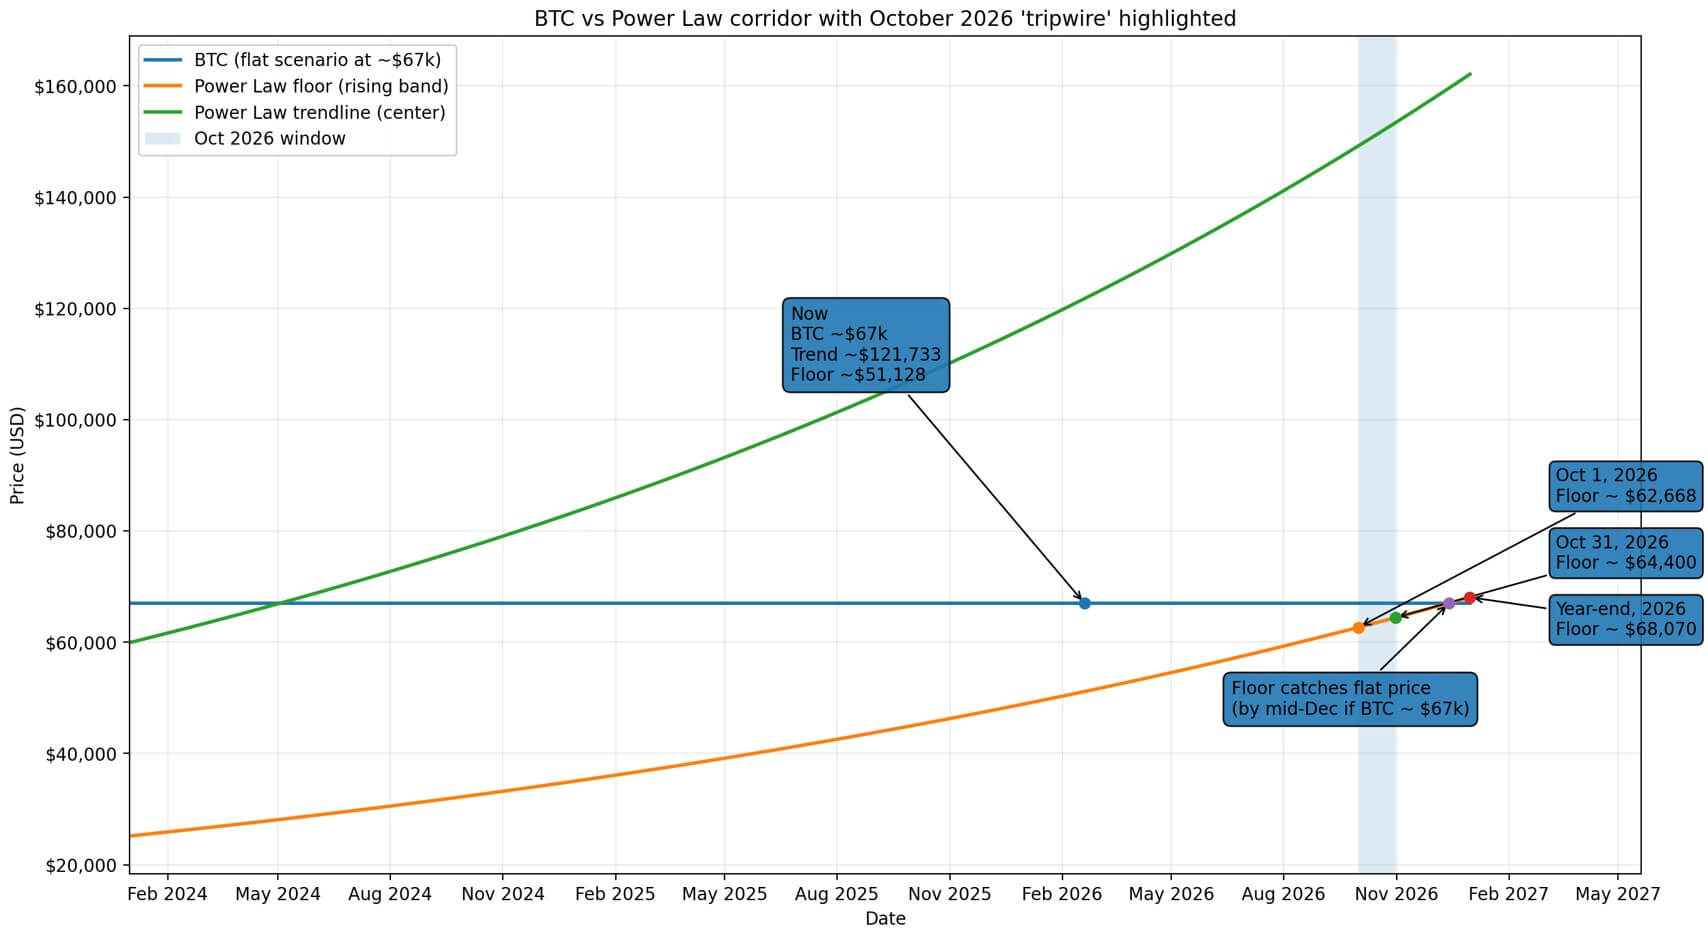
As of mid-February 2026, Newhedge’s live Power Law tracker places the central trendline around $121,733 and sets the floor near $51,128.
Currently trading at approximately $67,000, Bitcoin sits comfortably above this floor but significantly below its projected trendline.
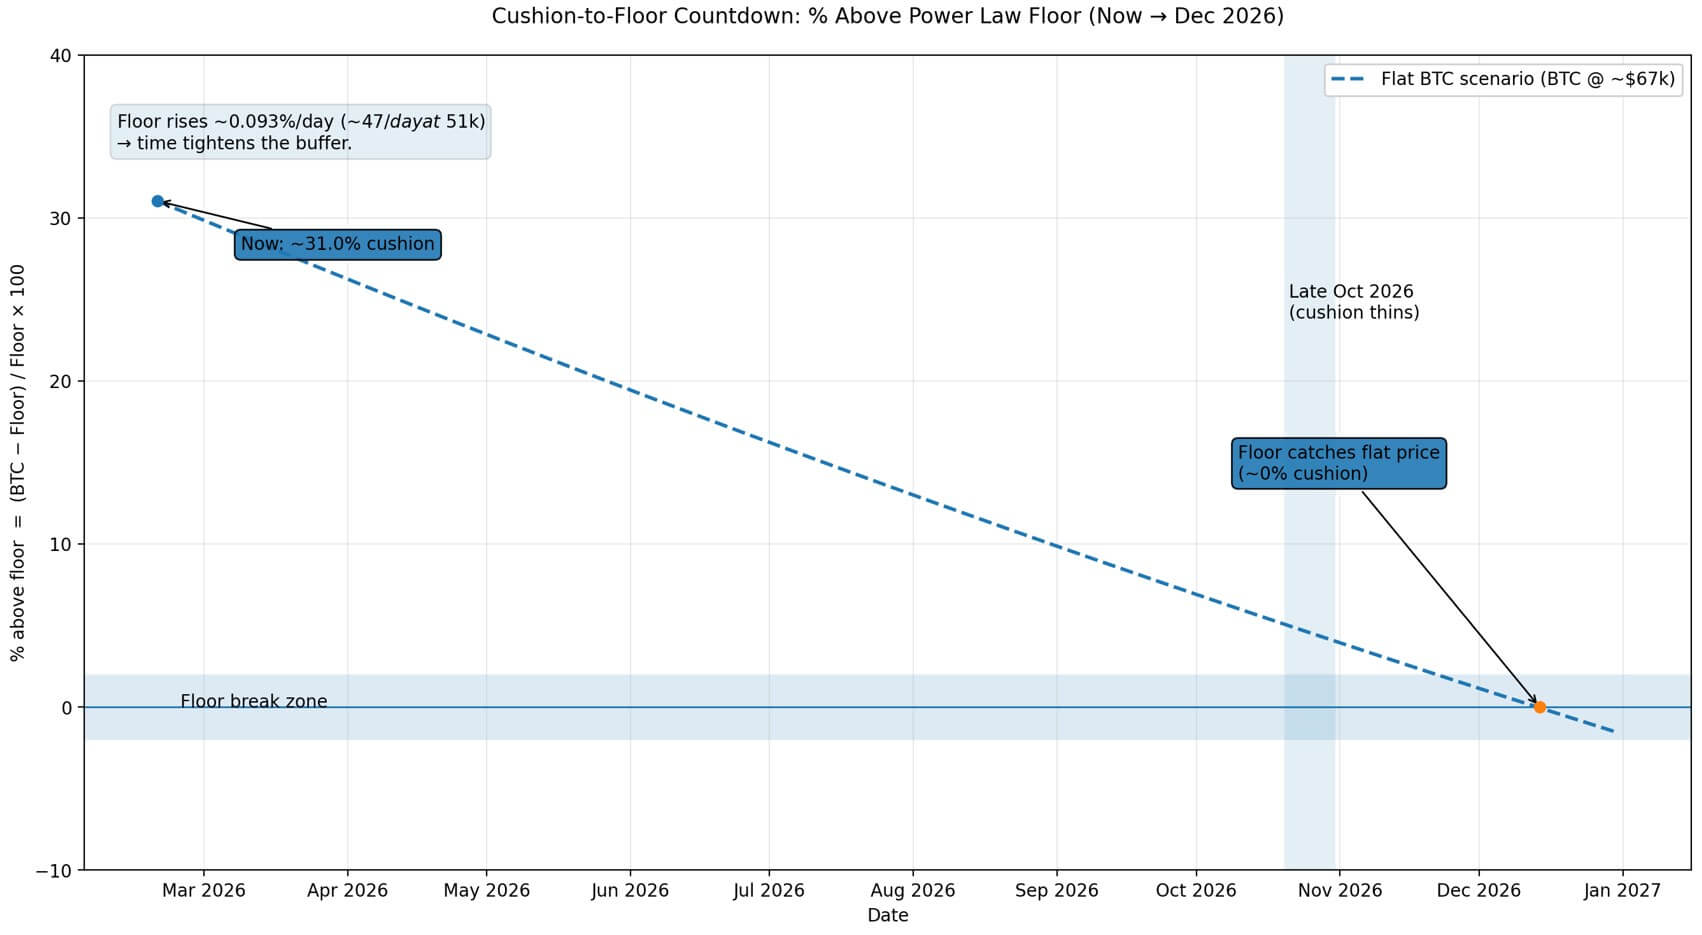
This floor is dynamic; anchored to time elapsed since Bitcoin’s genesis block on January 3rd, 2009. It grows roughly according to a power of 5.8 function—meaning it ascends about 0.093% daily or nearly $47 per day at present levels.
Projections estimate that by October 1st the floor will reach about $62,700; by October 31st around $64,400; and by year-end approximately $68,000.
This implies that if Bitcoin holds steady near current prices through fall months without upward momentum, it risks being caught by this rising threshold in mid-December. Any notable drop below mid-$60k levels in Q4 would trigger headlines highlighting a “first-ever break” from this established model.
The Model Explained Simply
The family of Power Law charts for Bitcoin fits its long-term pricing pattern onto a power curve over time—often visualized as straight lines on logarithmic scales for both axes (log-log plots).
Newhedge credits astrophysicist Giovanni Santostasi with developing this long-term log-log power-law framework where prices grow roughly proportional to time raised to about 5.8 power.
Rather than single lines alone these models typically include corridors: central regressions representing “fair value” trends flanked by upper and lower bounds acting as resistance and support zones respectively.
Santostasi presents his theory viewing Bitcoin as exhibiting scale-invariant growth characteristics—arguing that it qualifies scientifically because it can be falsified through empirical testing rather than mere speculation.
This scientific framing requires predefined rules for what constitutes breaking below the lower band—for example consecutive weekly closes beneath it—to avoid dismissing temporary dips as noise fluctuations only.
The Significance of October
The emphasis on October arises from how tightening timelines affect interpretation within this model:
- The ascending nature means even if prices remain flat throughout fall months—the increasing floor compresses available margin between actual price and modeled minimum value over time;
- By late October specifically,the bottom boundary climbs into mid-$60k territory;
- Sustained trading under these levels would produce clear headlines stating: “Bitcoin breaks Power Law support for first time.”
The implications are not dire for bitcoin itself—it wouldn’t invalidate cryptocurrency—but rather challenge specific parameter settings such as data sources or band placements used in modeling.
This would indicate shifts away from historical growth patterns toward slower appreciation rates.
It also provides critics with tangible evidence against claims based solely on past data fits.
Logarithmic regressions may appear stable retrospectively yet remain vulnerable statistically due to sensitivity regarding sample periods.
Tim Stolte from Amdax has notably criticized these models citing spurious correlations caused by selective sampling windows which can mislead conclusions.
A modest pullback between four-to-six percent — enough to touch or cross into low-mid sixties thousands — isn’t unusual given typical volatility ranges.
For instance,on February tenth implied volatility hovered near fifty-one point seven seven percent annualized,—a figure convertible into expected daily moves using Deribit’s DVOL metric (dividing annual volatilities by square root(365) yields approximate daily percentage swings).
Consequently,a sudden risk-off event could push bitcoin well below sixty-five thousand dollars temporarily.
Jurrien Timmer at Fidelity publicly identified roughly sixty-five thousand dollars as an important psychological threshold aligned with similar trends suggested via power law analysis.This convergence lends credibility beyond numerology toward institutional recognition where consensus reinforces significance through collective belief mechanisms known colloquially as reflexivity.
Possible Outcomes This Quarter
- A scenario warning against complacency amid sideways movement: although prices may seem stable,the rising baseline steadily erodes safety margins until late October when cushions vanish entirely if no gains occur;
- A volatility-driven possibility where normal monthly swings up to fifteen percent make breaches plausible especially following macroeconomic shocks or accelerated ETF withdrawals triggering immediate tests against floors;
- An anchoring effect emerging from mainstream institutional discourse repeatedly referencing mid-sixty-thousand-dollar bands creating coordination points reinforcing those thresholds psychologically among traders and investors alike due reflexive feedback loops inherent in markets;
Levels gain importance simply because participants collectively assign meaning.
The underlying drivers determining exact positioning within channels mainly revolve around ETF inflows/outflows dynamics alongside episodes marked by heightened risk aversion impacting broader financial markets.Both factors have recently influenced bitcoin performance amidst cooling demand narratives post early-2024 rally fueled largely via US spot ETFs moderation signals outflows weakening marginal bids coupled with macroeconomic shocks causing abrupt downside gaps relative smooth compounded trends assumed under pure mathematical modeling frameworks incorporating continuous compounding assumptions real-world discontinuities prevail instead.
If The Floor Is Breached What Happens?
A break beneath this modeled base does not negate bitcoin itself but invalidates certain calibrated parameters suggesting regime shifts away from historical trajectories while empowering skeptics’ narratives.Logarithmic regressions though seemingly robust retrospectively often suffer fragility stemming from sample bias potential spurious correlations plus overfitting risks.
However recent academic work published early February twenty-twenty-six corroborates approximate validity albeit proposing alternative slopes closer four point two based upon extended datasets spanning two thousand eleven through early twenty-twenty-six.Additionally,it introduces concepts like 'activity-warped-time’ adjusting temporal axes factoring transaction volumes &élasticity enhancing predictive accuracy despite observed parameter instability overall confirming ongoing evolution rather than outright failure.The core takeaway remains:the Power-Law approach offers foundational approximations adapting dynamically alongside maturing ecosystem developments.
| Date | $BTC} Projected Floor | $BTC Level Avoiding Break (≈ Floor) | “Cushion @ Price =$67K USD / % | |
|---|---|---|---|---|
| Now (mid-February 2026) | &dollar ;51 ,128 | &dollar ;51 ,128 | +&dollar ;15 ,872 / +31 .1 % | Low |
| Oct 1, 2026 | &dollar ;62 ,700 | & d o l l ar ;62 ,700 | + & d o l l ar ;4 ,300 / +6 .9 %Medium | |
Main Points To Monitor
Distance-to-floor metrics updated weekly provide cleanest insights.Triggers defining breaks should be pre-established clearly whether based on wicks,daily closes or weekly closures.Volatility regimes heavily influence likelihoods—as implied volatilities spike chances mechanically increase.Etf flow reports combined with macro risk-off events serve as catalysts pushing prices toward test zones.Model variations arise depending upon choices like starting points(genesis block vs exchange debut), frequency adjustments(refitting annually vs fixed parameters) producing divergent floors thus discrepancies across charts.A breach visible under one configuration might not appear elsewhere.October deadline reflects mechanical outcomes tied strictly to elapsed-time-based regression logic whereby floors ascend continuously.Flat trading leads inevitably towards convergence eliminating buffers.Likelihood significance depends entirely upon faith placed in predictive validity versus retrospective fitting artifacts.Either way forthcoming eight months promise definitive evaluation period ahead.