Bitcoin ($BTC) is currently at a critical juncture after encountering repeated challenges in surpassing the $76,000 resistance threshold. Following several rejections in this price range, the cryptocurrency has entered another phase of consolidation.
Bitcoin Poised for a ‘Final Surge’
Market analyst Ted Pillows recently shared an optimistic perspective on Wednesday, indicating that Bitcoin has emerged from a prolonged 7-month downtrend.
Pillows believes this change is reinforced by a technical indicator observed on the weekly chart: a bullish crossover in the MACD. He posits that these factors could catalyze what he terms as a final surge upwards, with $BTC potentially aiming for the $77,000 to $78,000 range.
However, Pillows also issued a cautionary note regarding this optimistic outlook. He mentioned that once Bitcoin reaches that level, it might experience declines to new yearly lows during the second quarter but did not specify how low $BTC could fall.
Pillows elaborated on why he anticipates such lows may occur later by referencing macroeconomic conditions. He believes that under new leadership at the Federal Reserve (Fed), there will be an acceleration of rate cuts and liquidity injections as mid-term elections draw near.
This shift in policy could help establish a market bottom for Bitcoin and pave the way for what he describes as a “V-shaped” recovery akin to those witnessed during March 2020 and again in April 2025.
A Scenario of Extreme Capitulation
An analysis from Ali Martinez focused more closely on timing and potential “capitulation” levels which might define support levels. Martinez pointed out that approximately $49,387 represents what he considers to be Long-Term Holder (LTH) Realized Price—the last line of defense within this cycle.
If Bitcoin can reach and maintain this level, it may avert further market decline into more severe territory. Nevertheless, Martinez also described an extreme scenario—a so-called “black swan” event—where prices could plunge downwards towards -0.2 Standard Deviation Band at around $36,657.
The two levels highlighted by Martinez can be seen as “Generational Entries,” suggesting they are points where long-term investors may step back into action and where market dynamics begin shifting from capitulation towards recovery.
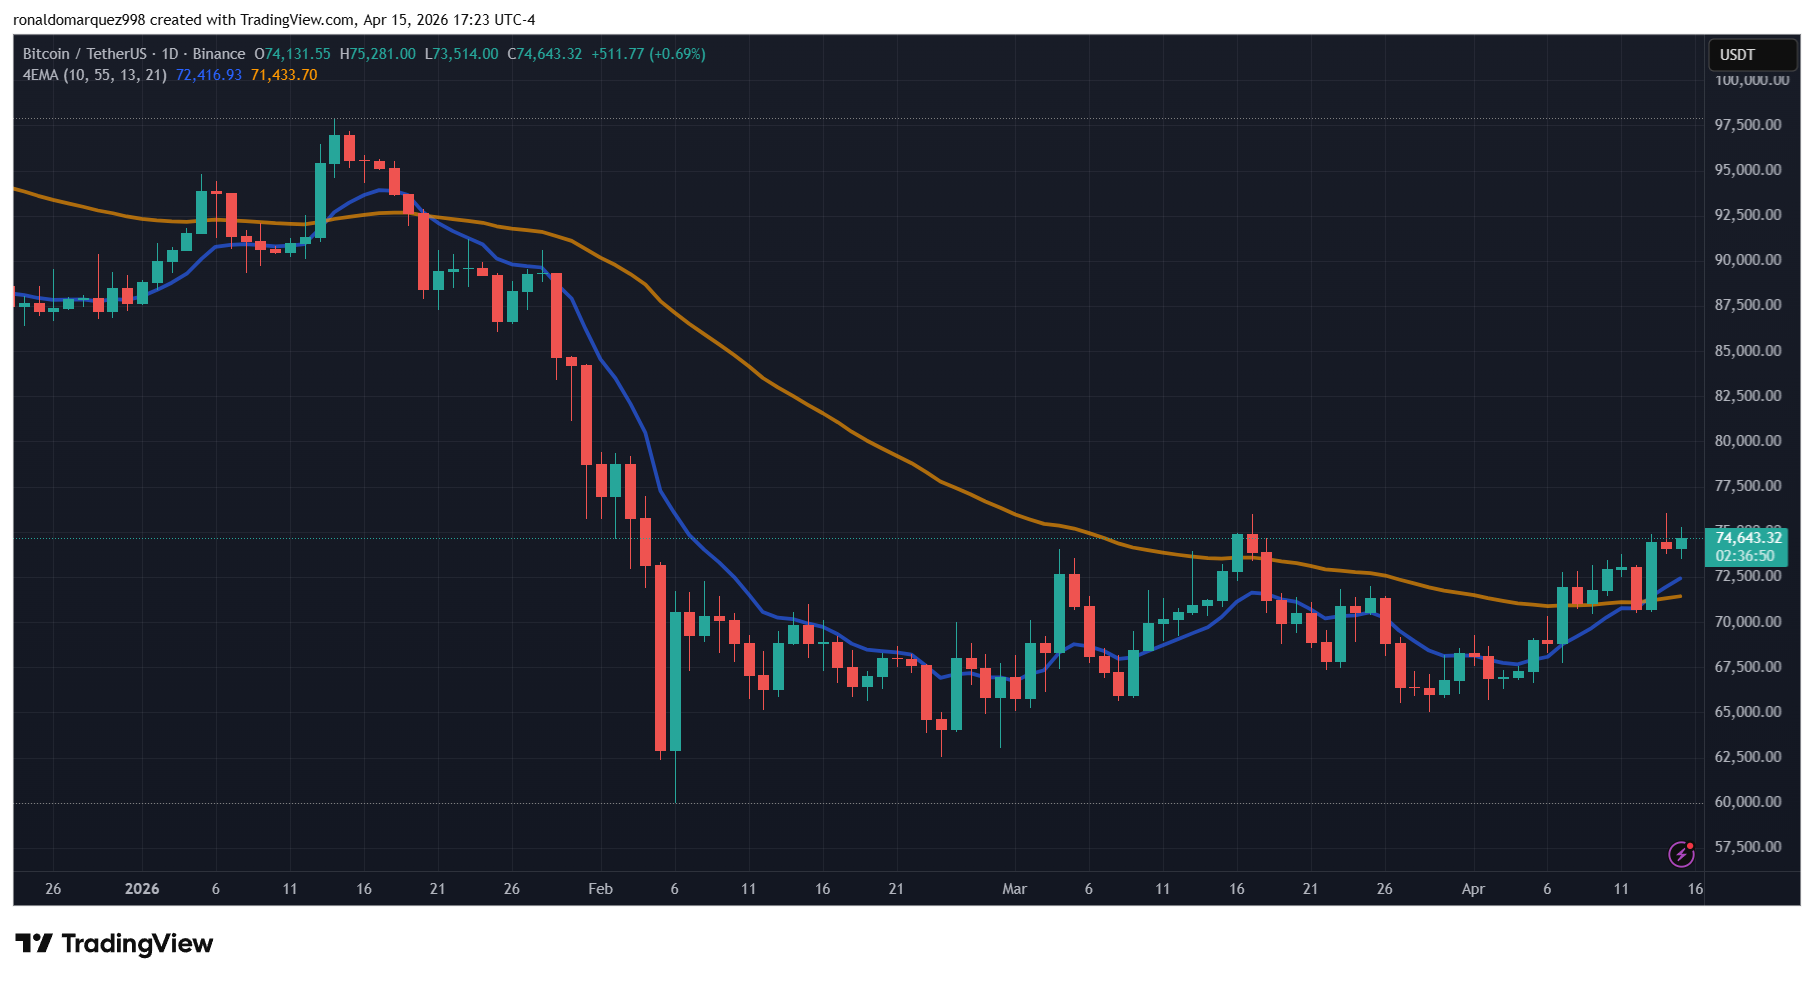
Image courtesy of OpenArt; chart data sourced from TradingView.com