On Saturday morning at 8:30 a.m., Bitcoin was priced at $70,646, maintaining a tight trading range as technical indicators indicated a largely neutral sentiment across various timeframes. Traders are closely observing the consolidation around the $70,000 mark while momentum signals show divergence and volatility appears to be decreasing.
Bitcoin Price Analysis
The daily chart indicates that Bitcoin is stabilizing after retreating from its recent peak of approximately $76,000. Currently, trading is confined within the bounds of roughly $69,500 and $70,800.
This sideways movement suggests a temporary halt in directional momentum with the psychological level of $70,000 serving as an anchor. Although the overall upward trend remains intact, the lack of significant price movement implies that traders may be awaiting a catalyst rather than pushing for continuation.
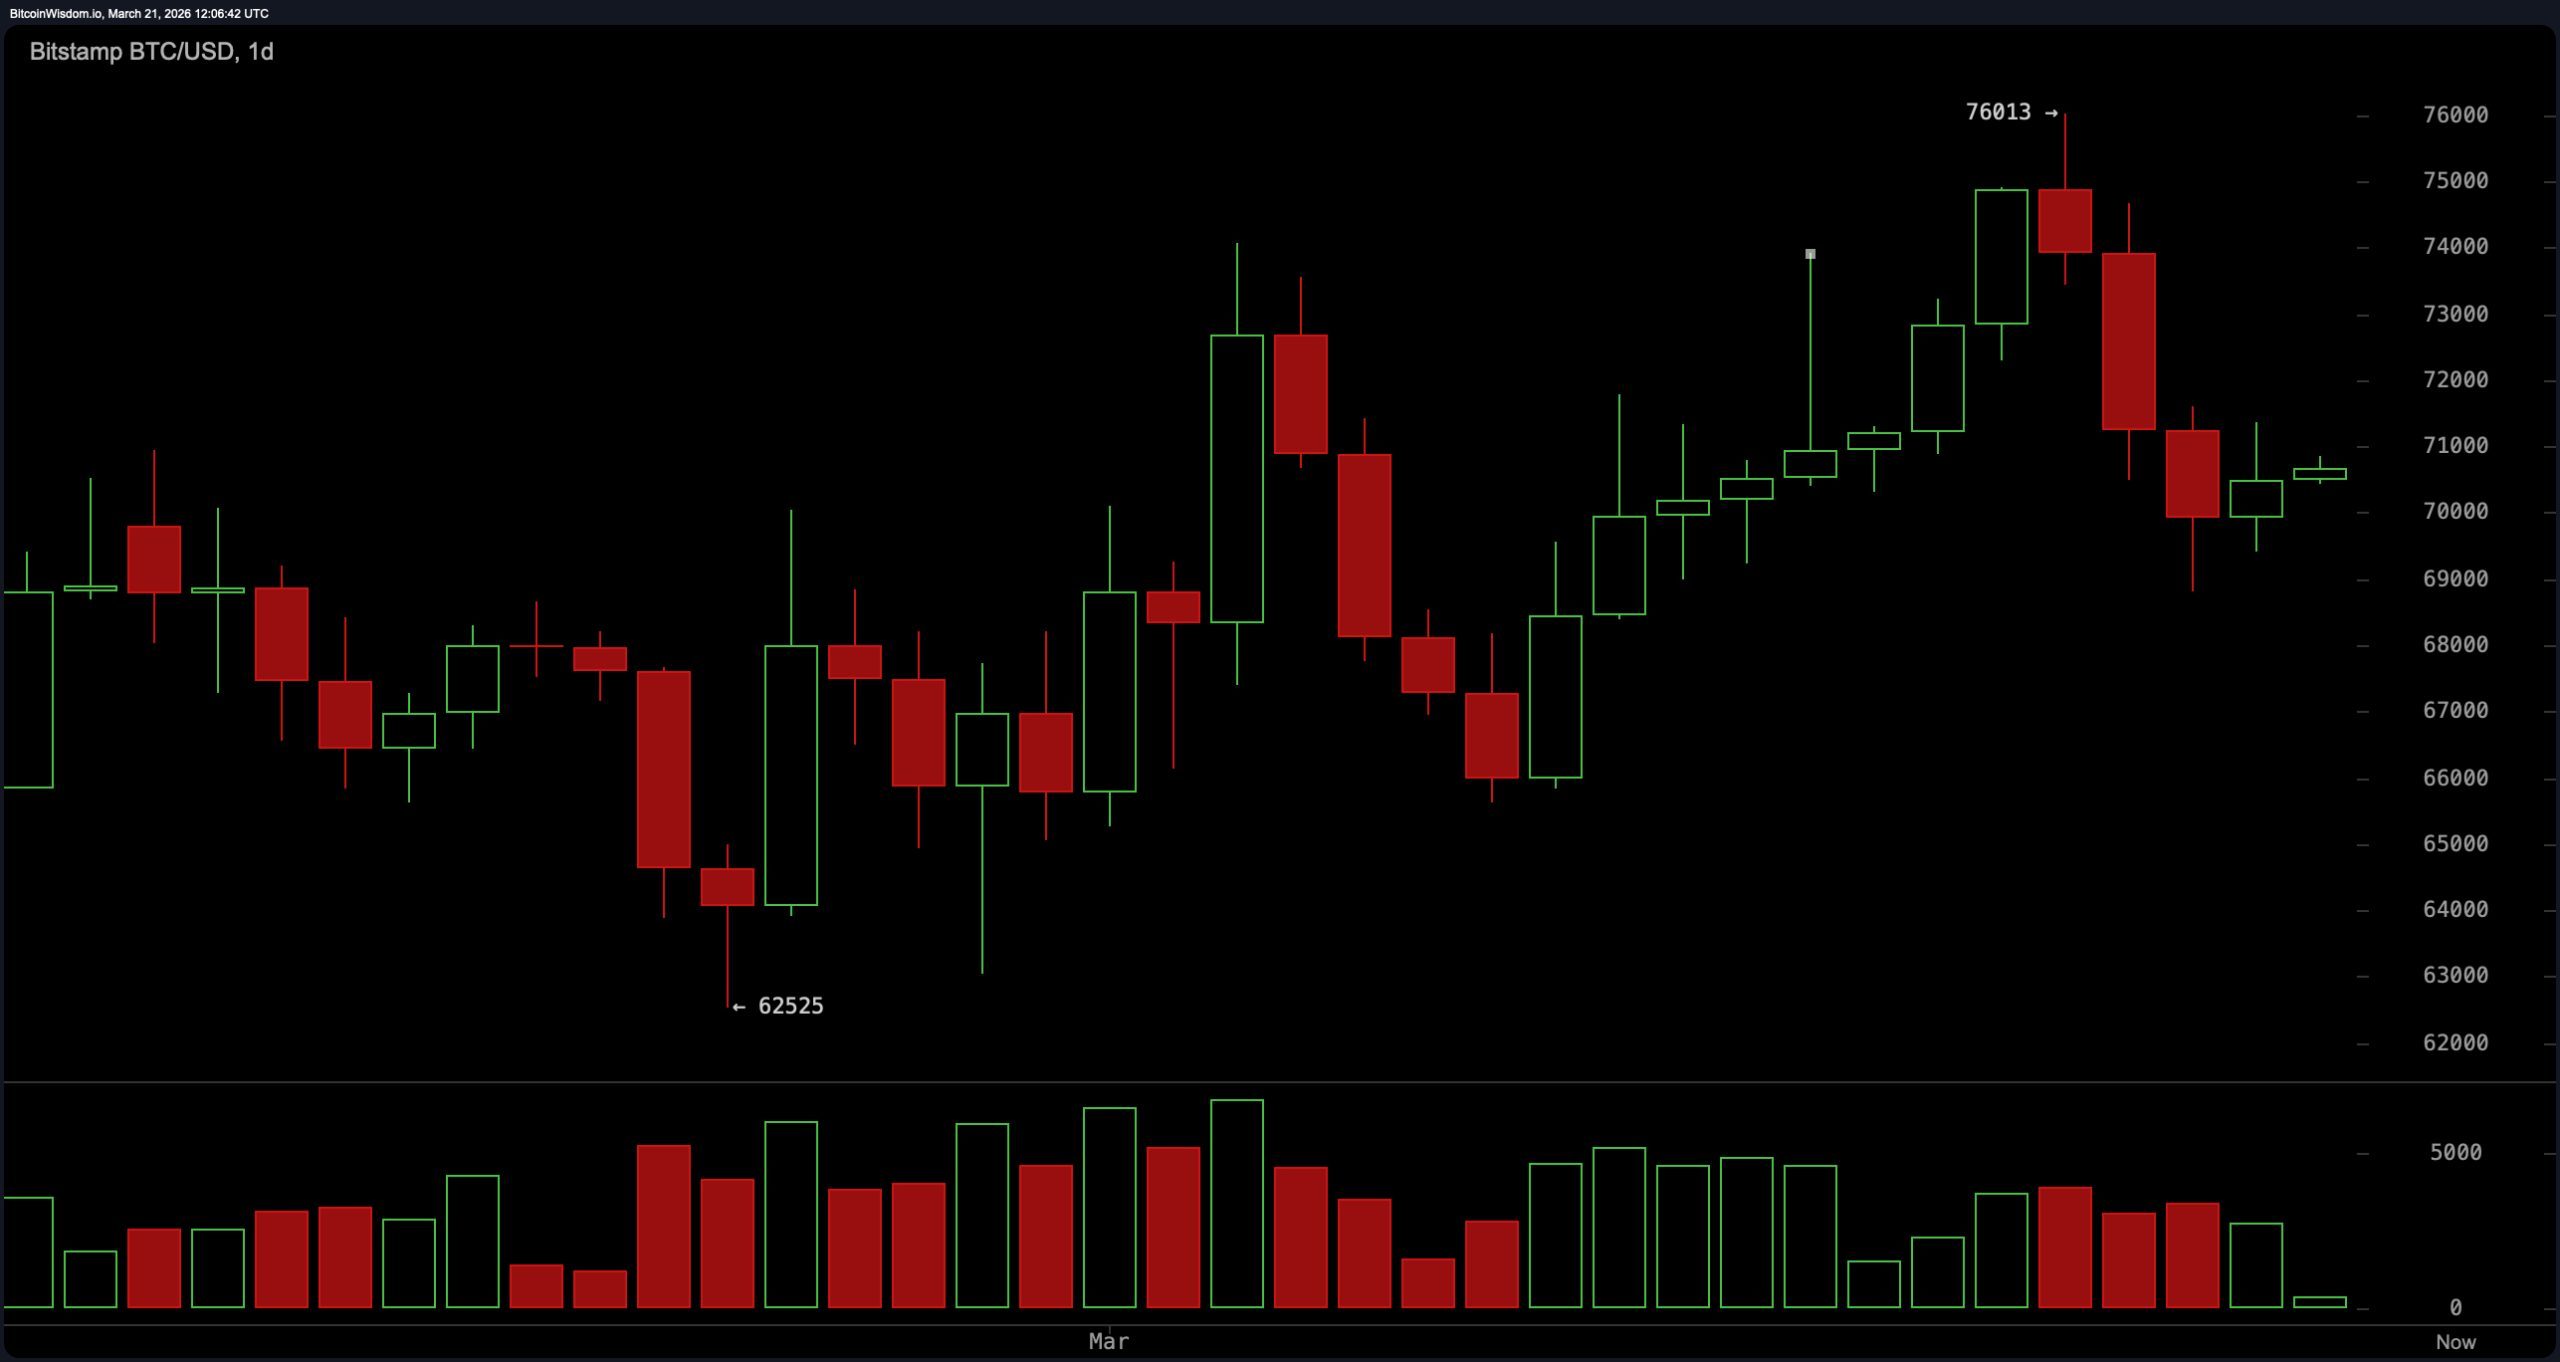
$BTC/USD one-day chart via Bitstamp on March 21, 2026.
On the four-hour chart, Bitcoin displays clear signs of consolidation between support levels near $69,000 and resistance ranging from about $71,500 to $72,000. The previous sharp decline from around $76K to nearly $68.8K reset short-term momentum; however,the subsequent recovery has not been backed by strong volume confirmation. This indecisiveness leaves both buyers and sellers without sustained control over price action.
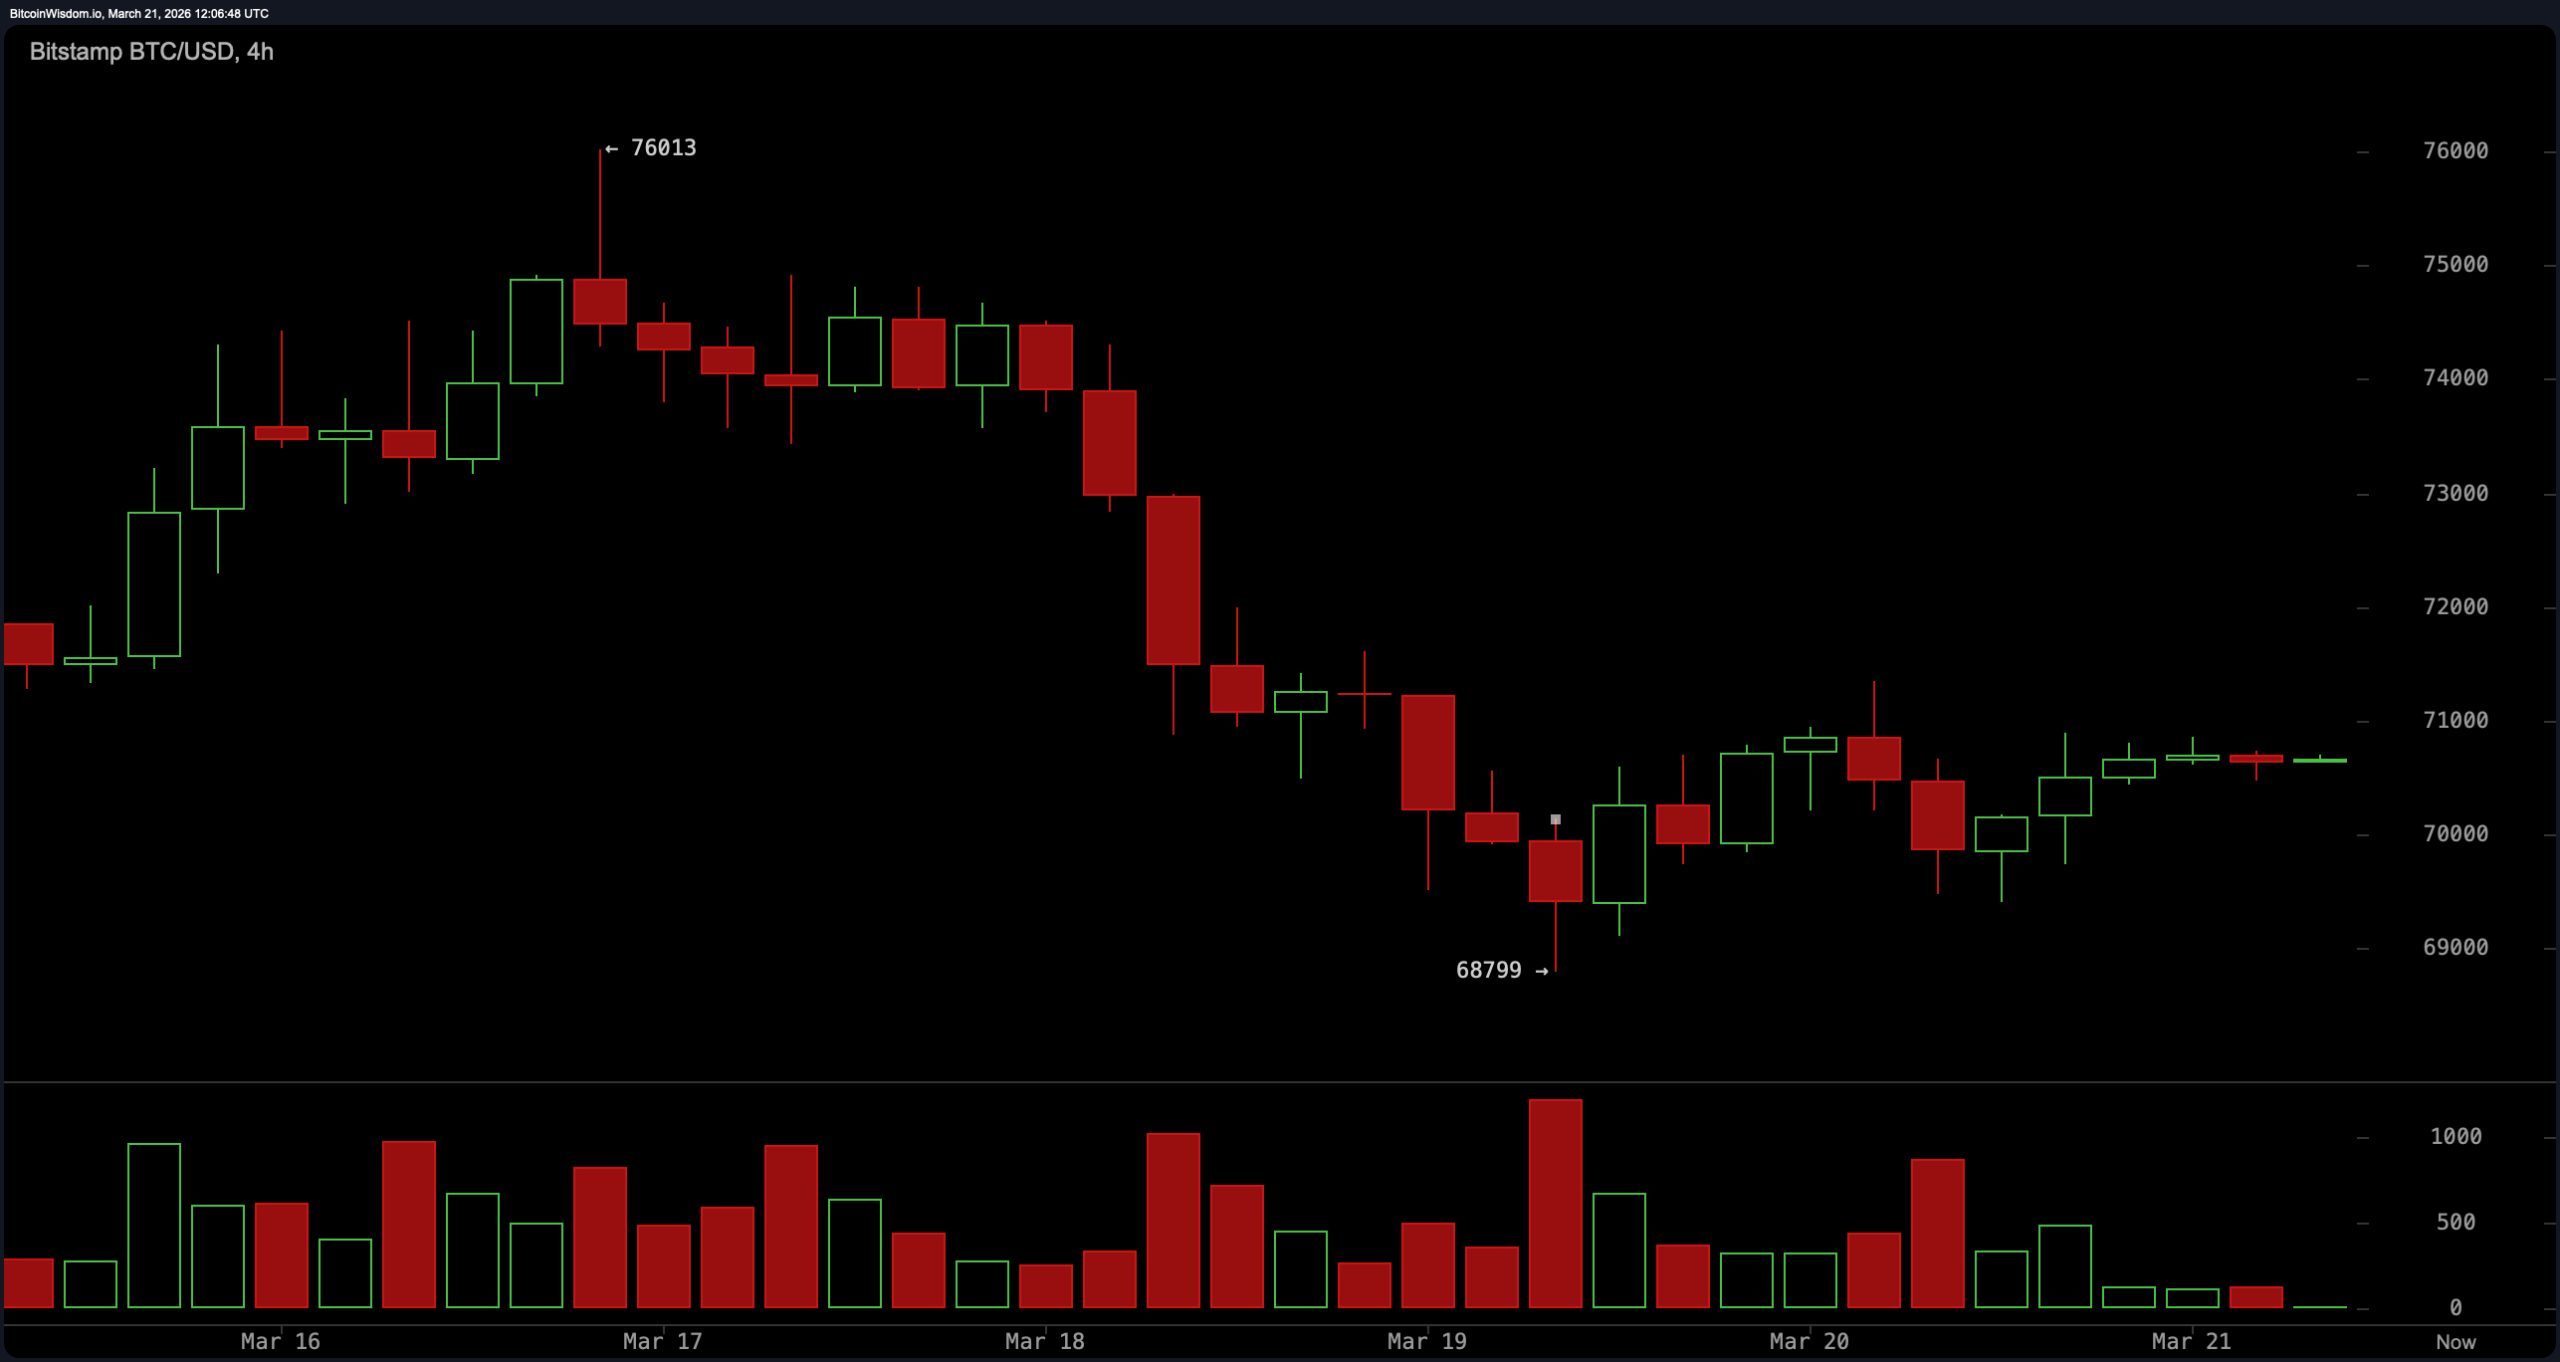
$BTC/USD four-hour chart via Bitstamp on March 21,2026.
The one-hour analysis further emphasizes this neutral stance with tight compression occurring within the range of approximately $70,500 to $71,000 alongside diminished volatility and smaller candlestick formations. Such coiling behavior often precedes significant directional moves; however,for now it reflects balance between supply and demand dynamics in play. Volume remains steady without providing any decisive advantage for short-term traders seeking clarity.
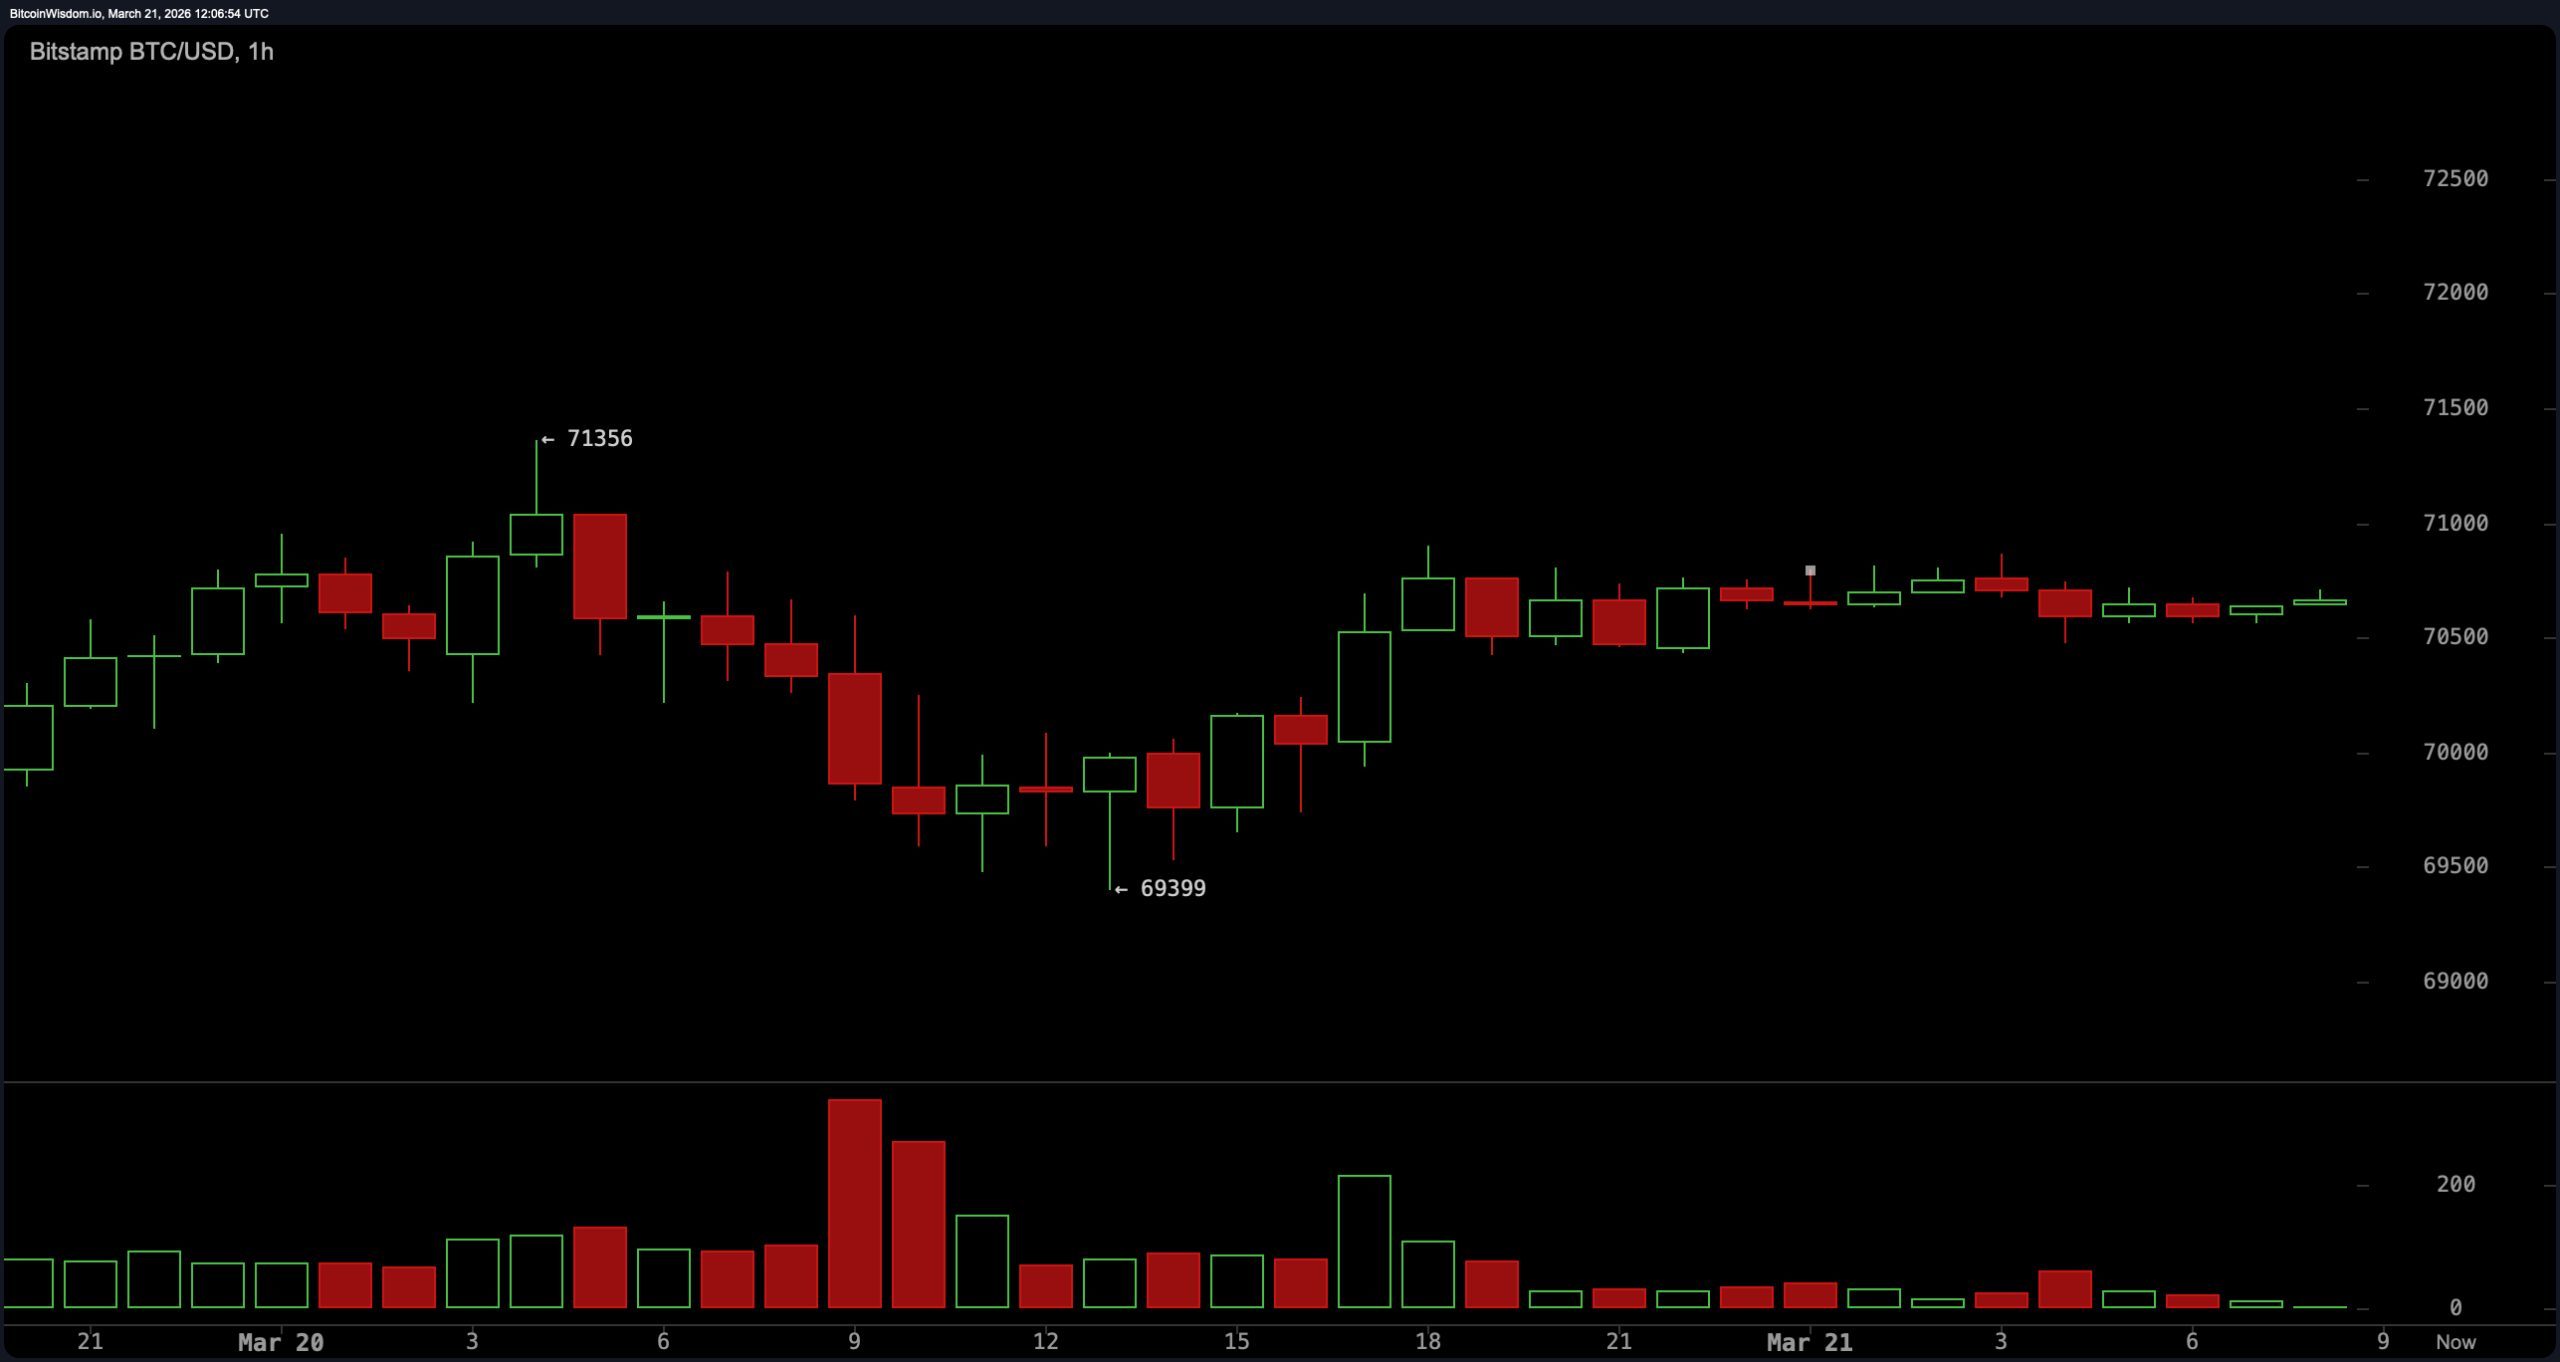
$BTC/USD one-hour chart via Bitstamp on March 21,2026.
The oscillators shown in the daily chart reflect this uncertainty as well; with relative strength index (RSI) positioned at 50 while Stochastic registers at 46 along with commodity channel index (CCI) showing readings around 12—all indicating neutral market conditions.
The average directional index (ADX) stands at 21 suggesting weak trend strength while Awesome oscillator also remains neutral overall.Momentum indicator (10) leans towards negative territory whereas moving average convergence divergence(MACD) indicates positive values creating mixed signals which highlight ongoing market indecision among participants。
Moving averages present an equally ambiguous scenario—shorter-term exponential moving averages(EMA)and simple moving averages(SMA)—indicate close interaction with$70,000 including20 EMA valued at$70,547and20 SMA positionedat$70,370both signifying potential support levels。
However longer-term metrics suchas100 EMA locatedat$78,664and200 SMA hoveringaround$92,798remain significantly above current prices thereby exerting broader overhead pressure.A combined signal tally reveals9 indications pointing downward bias10 remainneutralwhile7 suggest upward trends keeping overall technical outlook firmly entrenched within neutrality wherein bitcoin essentially treads water instead making assertive moves forward。
Bullish Outlook:
If Bitcoin manages to secure acceptance above resistance levels ranging from$71,.500to$72,.000with sustained volume backing it up then this current phase could potentially transition into continuation toward targets near$73,.00and possibly retesting areas between$75,.00to$76,.00.Reclaiming short term moving averages would bolster bullish structure shifting momentum indicators outof their existing neutrality position。
Bearish Outlook:
If Bitcoin falls below critical support situatedaround$69,.00then consolidation will break downwards exposing new areas like $68.00or even lower toward $66.00.Further weakness beneath key shorter term averages coupledwith softeningmomentum readingswould imply additional downside pressures as markets exit their present equilibrium state .
Frequently Asked Questions 🔎
What’s bitcoin’s value onMarch21st ,2026?Bitcoin tradesclose to $(70346),remainingwithin tightconsolidationnear $(70000).
Isbitcoinstill bullish orbearishcurrently?Currently ,it staysneutrallyalignedas mixedsignalsalongside sidewayspriceaction indicate no discernibletrend direction .
Whatarekeysupport &resistancelevelsfor bitcoin ? Keysupportis foundnear $(69000 )while resistancerangesbetween $(71500)& $(7200 ).
Whataretechnicalindicatorsofbitcoin signaling ?Oscillators&movingaveragesexhibitmixedsignalingreflectingweakmomentum&ongoingmarketindecision .