Bitcoin remained close to the $67,000 mark following a significant decline from its late 2025 peak. Notably, a monthly CME liquidity zone and a weekly stochastic golden cross now converge around this price level.
Bitcoin CME Futures Approach $67K Liquidity Zone as $87K Resistance Reemerges
The Bitcoin CME futures hovered near $67,800 on the monthly timeframe, entering a high-volume liquidity region identified by X user Cantonese Cat. The volume profile displayed on the chart’s right side revealed concentrated historical trading activity between $60,000 and $72,000. This indicates that the market is revisiting an area where substantial position building previously occurred.
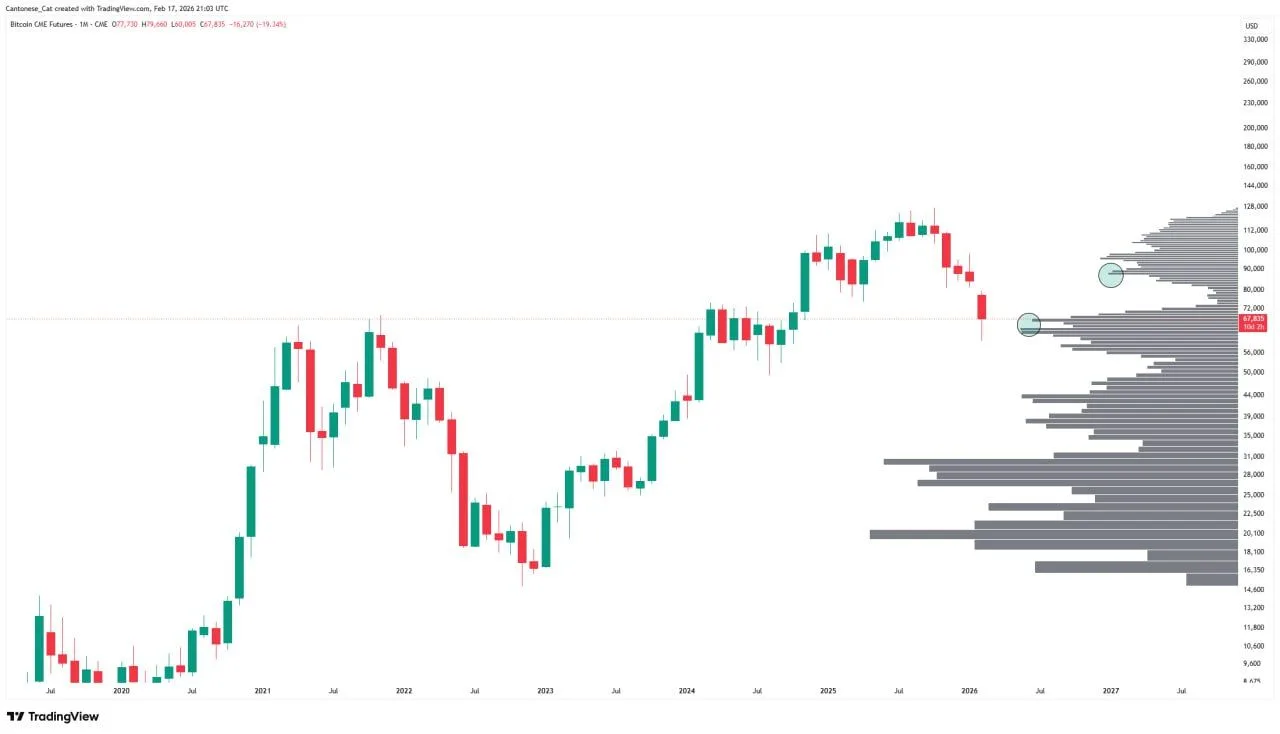
Monthly Chart of Bitcoin CME Futures. Source: Cantonese Cat via X
Recent candlesticks reveal a sharp pullback from highs above $100,000 in late 2025 down to mid-$60,000 levels. This drop followed multiple months of lower closes after failing to sustain gains beyond earlier resistance near the range’s top boundary. As such, price action shifted from an extended uptrend into a more balanced consolidation phase centered around this liquidity shelf.
The volume profile’s concentration at current prices suggests intense competition between buyers and sellers within this zone. Several monthly candles also exhibit wicks penetrating this area repeatedly rather than breaking cleanly through it—indicating ongoing tests of support or resistance here. Therefore, this region serves as an important technical benchmark for determining whether Bitcoin will stabilize or continue searching for lower acceptance levels.
Cantonese Cat commented that this liquidity band is currently “holding.” If it remains intact, there is potential for Bitcoin CME futures to retest higher ground near $87,000—a level visible further up on the chart with notable past activity. However, heavy supply overhead throughout the mid-$70k range means any upward move must reclaim these zones convincingly before signaling broader bullish momentum.
Weekly Chart Displays Stochastic Golden Cross While Price Trades Near $68K
On Binance’s BTCUSDT weekly chart trading close to $68,115 showed signs of forming a stochastic golden cross according to X user CryptosBatman. This crossover emerged after weeks of downward pressure pushed prices down from just over $100k into mid-$60k territory—marking momentum’s shift from decline toward short-term stabilization within the weekly timeframe.
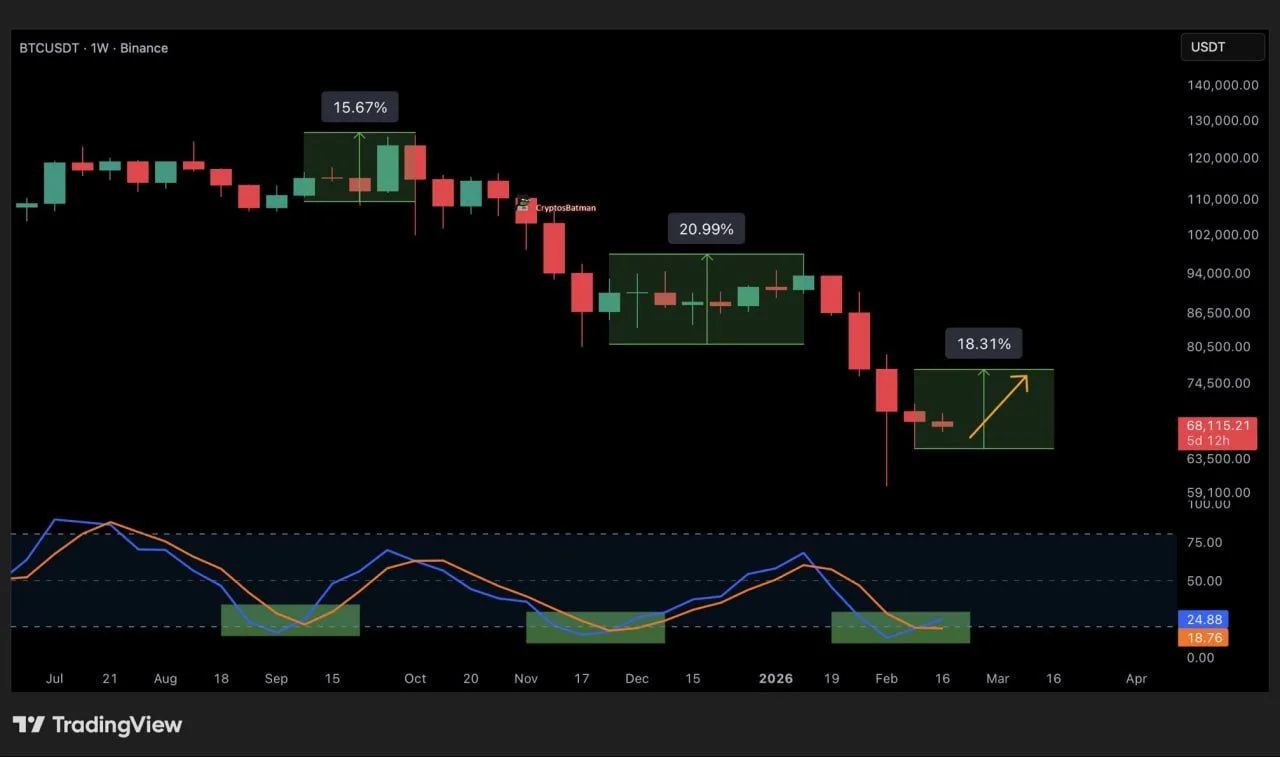
Weekly BTCUSDT Chart for Bitcoin.Source: TradingView / X
This chart highlights two previous stochastic golden crosses over recent six months which preceded rebounds ranging roughly 15%–21% before resuming larger trends. Currently price consolidates tightly between approximately $63,500 and$75 ,000—a zone where selling pressure has eased since last declines—placing market conditions at key technical juncture linked historically with short-term recoveries triggered by similar signals.
The weekly structure shows successive lower highs and lows since late-2025 peaks near low-$110k levels while recent candles feature long lower shadows around$60 ,000 indicating rejection attempts below that point during testing phases.This crossover formed as prices held above prior lows instead of surging sharply upwards confirming momentum reset rather than full trend reversal so far.
The stochastic oscillator rose off oversold territory with its faster line crossing above slower counterpart well below midpoint values reinforcing interpretation as momentum adjustment not definitive directional change.Previous rebounds under comparable setups stalled against nearby resistance clusters still present above current valuations suggesting caution despite positive signal emergence in short term outlooks.